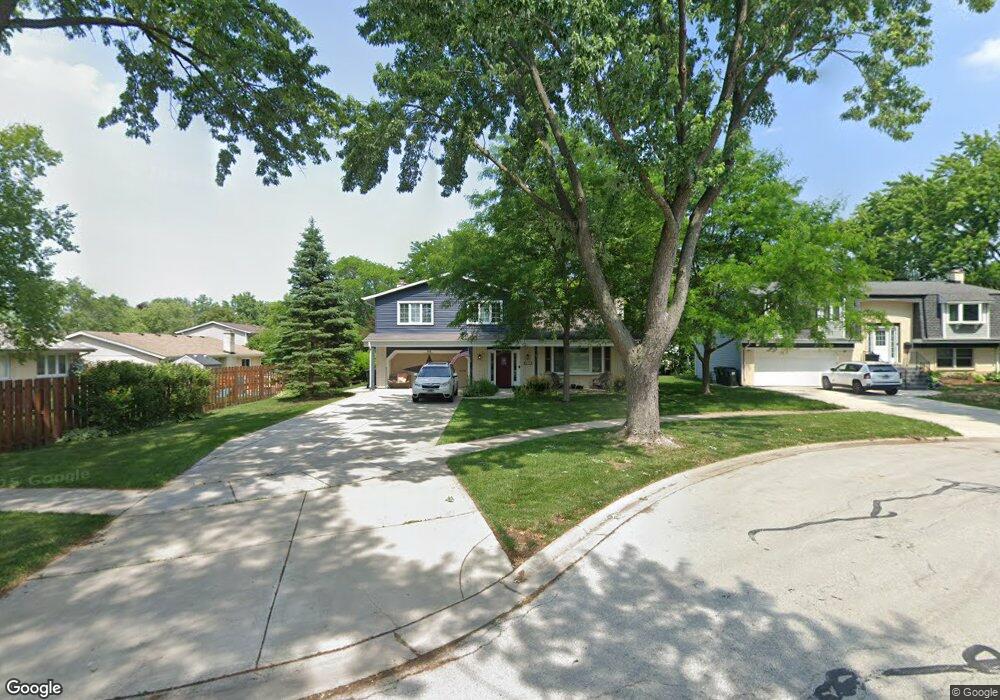
155 W Garden Ct Palatine, IL 60067
Pepper Tree NeighborhoodEstimated Value: $448,000 - $526,550
3
Beds
3
Baths
2,061
Sq Ft
$236/Sq Ft
Est. Value
About This Home
This home is located at 155 W Garden Ct, Palatine, IL 60067 and is currently estimated at $486,638, approximately $236 per square foot. 155 W Garden Ct is a home located in Cook County with nearby schools including Lincoln Elementary School, Walter R. Sundling Junior High School, and Palatine High School.
Ownership History
Date
Name
Owned For
Owner Type
Purchase Details
Closed on
Mar 2, 2023
Sold by
Mccall Matthew C and Mccall Jennifer L
Bought by
Jennifer L Mccall Trust and Mccall
Current Estimated Value
Purchase Details
Closed on
Aug 14, 2001
Sold by
Chryssafis Anthony N and Chryssafis Helen L
Bought by
Mccall Matthew C and Mccall Jennifer L
Home Financials for this Owner
Home Financials are based on the most recent Mortgage that was taken out on this home.
Original Mortgage
$237,600
Interest Rate
7.03%
Purchase Details
Closed on
Dec 6, 1994
Sold by
Tumminello Angelo L and Tumminello Virginia M
Bought by
Chryssafis Anthony N and Chryssafis Helen L
Home Financials for this Owner
Home Financials are based on the most recent Mortgage that was taken out on this home.
Original Mortgage
$172,400
Interest Rate
9.06%
Create a Home Valuation Report for This Property
The Home Valuation Report is an in-depth analysis detailing your home's value as well as a comparison with similar homes in the area
Home Values in the Area
Average Home Value in this Area
Purchase History
| Date | Buyer | Sale Price | Title Company |
|---|---|---|---|
| Jennifer L Mccall Trust | -- | None Listed On Document | |
| Mccall Matthew C | $297,000 | Lawyers Title Insurance Corp | |
| Chryssafis Anthony N | $215,500 | -- |
Source: Public Records
Mortgage History
| Date | Status | Borrower | Loan Amount |
|---|---|---|---|
| Previous Owner | Mccall Matthew C | $237,600 | |
| Previous Owner | Chryssafis Anthony N | $172,400 |
Source: Public Records
Tax History Compared to Growth
Tax History
| Year | Tax Paid | Tax Assessment Tax Assessment Total Assessment is a certain percentage of the fair market value that is determined by local assessors to be the total taxable value of land and additions on the property. | Land | Improvement |
|---|---|---|---|---|
| 2024 | $10,268 | $38,000 | $10,140 | $27,860 |
| 2023 | $9,904 | $38,000 | $10,140 | $27,860 |
| 2022 | $9,904 | $38,000 | $10,140 | $27,860 |
| 2021 | $9,147 | $31,494 | $6,337 | $25,157 |
| 2020 | $9,083 | $31,494 | $6,337 | $25,157 |
| 2019 | $9,108 | $35,189 | $6,337 | $28,852 |
| 2018 | $9,169 | $32,939 | $5,703 | $27,236 |
| 2017 | $9,014 | $32,939 | $5,703 | $27,236 |
| 2016 | $8,632 | $32,939 | $5,703 | $27,236 |
| 2015 | $8,097 | $28,977 | $5,070 | $23,907 |
| 2014 | $8,015 | $28,977 | $5,070 | $23,907 |
| 2013 | $7,793 | $28,977 | $5,070 | $23,907 |
Source: Public Records
Map
Nearby Homes
- 1113 N Smith St
- 1065 N Smith St
- 133 W King George Ct Unit 1
- 1342 N Wellington Ct
- 254 W Fairfield Ct
- 1553 N Saint Marks Place
- 1309 W Dundee Rd
- 358 W Birchwood Ave
- 1109 N Thackeray Dr
- 230 W Golfview Terrace
- 1527 Louise Ln
- 1535 N Elm St
- 650 W Echo Ln
- 219 E Reseda Pkwy
- 966 N Auburn Woods Dr
- 234 W Jennifer Ln Unit 33A
- 414 E Thornhill Ln Unit 4S414
- 1288 N Ashland Ave Unit 1
- 858 N Auburn Woods Dr
- 1512 N Waterbury Cir Unit 7Q1
- 123 W Garden Ave
- 141 W Garden Ave
- 111 W Garden Ave Unit 2
- 1136 N King Arthur Ct
- 1146 N King Arthur Ct
- 1126 N King Arthur Ct
- 1152 N King Arthur Ct
- 173 W Garden Ave
- 1120 N King Arthur Ct
- 161 W Garden Ct
- 169 W Garden Ct
- 1114 N King Arthur Ct
- 185 W Garden Ave
- 130 W Garden Ave
- 124 W Garden Ave
- 165 W Garden Ct
- 142 W Garden Ave
- 112 W Garden Ave
- 156 W Garden Ave
- 132 W King Arthur Ct Unit 2