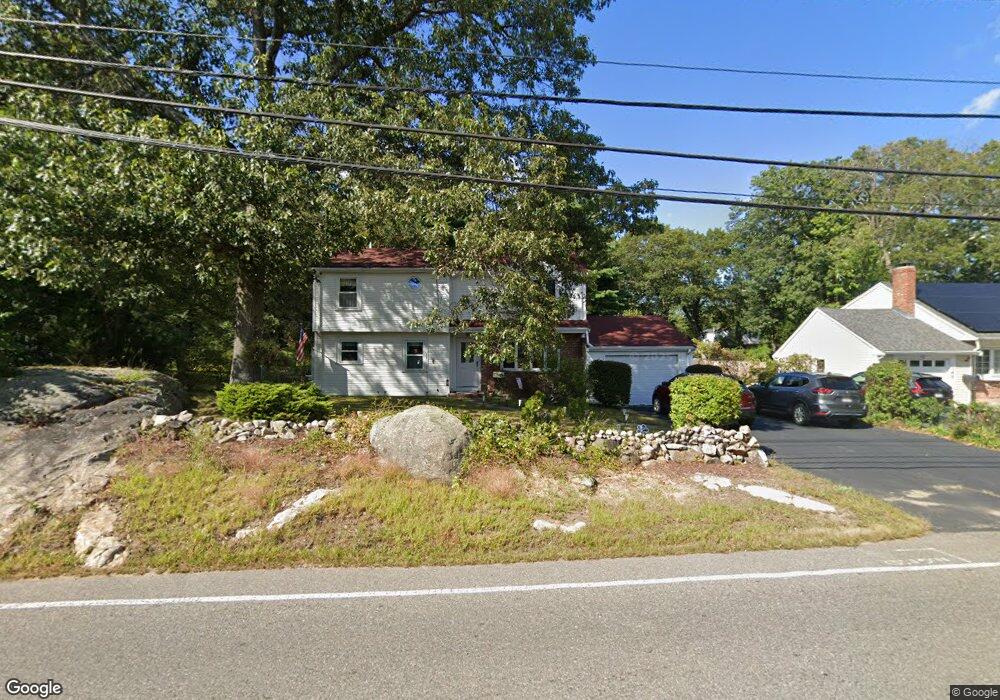
155 West St Weymouth, MA 02188
South Weymouth NeighborhoodEstimated Value: $673,000 - $703,260
4
Beds
2
Baths
1,476
Sq Ft
$467/Sq Ft
Est. Value
About This Home
This home is located at 155 West St, Weymouth, MA 02188 and is currently estimated at $689,565, approximately $467 per square foot. 155 West St is a home located in Norfolk County with nearby schools including Thomas V Nash, Abigail Adams Middle School, and Weymouth Middle School Chapman.
Ownership History
Date
Name
Owned For
Owner Type
Purchase Details
Closed on
May 19, 2022
Sold by
Malone Dennis M and Malone Joanne G
Bought by
Dennis M Malone T
Current Estimated Value
Purchase Details
Closed on
May 15, 1987
Sold by
Corey Steven S
Bought by
Malone Dennis M
Home Financials for this Owner
Home Financials are based on the most recent Mortgage that was taken out on this home.
Original Mortgage
$83,450
Interest Rate
9.31%
Mortgage Type
Purchase Money Mortgage
Create a Home Valuation Report for This Property
The Home Valuation Report is an in-depth analysis detailing your home's value as well as a comparison with similar homes in the area
Home Values in the Area
Average Home Value in this Area
Purchase History
| Date | Buyer | Sale Price | Title Company |
|---|---|---|---|
| Dennis M Malone T | -- | None Available | |
| Malone Dennis M | $166,900 | -- |
Source: Public Records
Mortgage History
| Date | Status | Borrower | Loan Amount |
|---|---|---|---|
| Previous Owner | Malone Dennis M | $110,000 | |
| Previous Owner | Malone Dennis M | $83,450 |
Source: Public Records
Tax History Compared to Growth
Tax History
| Year | Tax Paid | Tax Assessment Tax Assessment Total Assessment is a certain percentage of the fair market value that is determined by local assessors to be the total taxable value of land and additions on the property. | Land | Improvement |
|---|---|---|---|---|
| 2025 | $6,240 | $617,800 | $229,300 | $388,500 |
| 2024 | $6,018 | $586,000 | $218,400 | $367,600 |
| 2023 | $5,672 | $542,800 | $202,200 | $340,600 |
| 2022 | $5,516 | $481,300 | $187,200 | $294,100 |
| 2021 | $5,263 | $448,300 | $187,200 | $261,100 |
| 2020 | $5,066 | $425,000 | $187,200 | $237,800 |
| 2019 | $4,979 | $410,800 | $180,000 | $230,800 |
| 2018 | $4,749 | $379,900 | $171,500 | $208,400 |
| 2017 | $4,722 | $368,600 | $163,300 | $205,300 |
| 2016 | $4,463 | $348,700 | $157,000 | $191,700 |
| 2015 | $4,345 | $336,800 | $157,000 | $179,800 |
| 2014 | $4,160 | $312,800 | $146,100 | $166,700 |
Source: Public Records
Map
Nearby Homes
- 255 West St
- 262 West St
- 92 Mercury St
- 2 Mitchell Ln Unit B
- 116 Belmont St
- 308 Forest St
- 16 Jay Rd
- 24 Fisher Rd
- 200 Justin Dr Unit 3
- 501 Commerce Dr Unit 2310
- 501 Commerce Dr Unit 1111
- 501 Commerce Dr Unit 4206
- 501 Commerce Dr Unit 4308
- 501 Commerce Dr Unit 4306
- 27 Park Ave
- 2 Tara Dr Unit 1
- 68 Massapoag St Unit 7
- 441 Grove St
- 432 Grove St
- 200 Burkhall St Unit 803