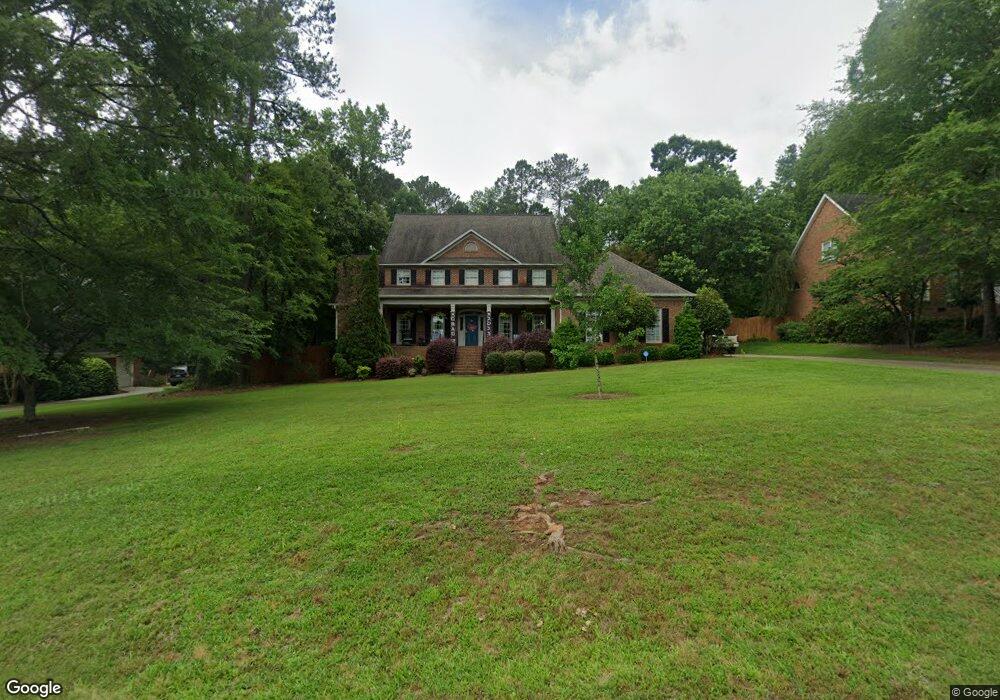
155 Westchester Dr Macon, GA 31210
Estimated Value: $586,000 - $706,000
4
Beds
4
Baths
4,586
Sq Ft
$140/Sq Ft
Est. Value
About This Home
This home is located at 155 Westchester Dr, Macon, GA 31210 and is currently estimated at $640,196, approximately $139 per square foot. 155 Westchester Dr is a home located in Bibb County with nearby schools including Springdale Elementary School, Howard Middle School, and Howard High School.
Ownership History
Date
Name
Owned For
Owner Type
Purchase Details
Closed on
May 12, 2020
Sold by
Mixon Stephen
Bought by
Mixon Elizabeth S
Current Estimated Value
Home Financials for this Owner
Home Financials are based on the most recent Mortgage that was taken out on this home.
Original Mortgage
$300,500
Outstanding Balance
$265,701
Interest Rate
3.3%
Mortgage Type
New Conventional
Estimated Equity
$374,495
Purchase Details
Closed on
Jun 20, 2008
Sold by
Mixon Stephen
Bought by
Mixon Stephen and Mixon Elizabeth S
Purchase Details
Closed on
Jun 7, 2006
Sold by
Mixon Stephen
Bought by
Mixon Elizabeth S
Home Financials for this Owner
Home Financials are based on the most recent Mortgage that was taken out on this home.
Original Mortgage
$325,600
Interest Rate
6.5%
Mortgage Type
New Conventional
Purchase Details
Closed on
Mar 27, 1998
Purchase Details
Closed on
Aug 6, 1997
Create a Home Valuation Report for This Property
The Home Valuation Report is an in-depth analysis detailing your home's value as well as a comparison with similar homes in the area
Home Values in the Area
Average Home Value in this Area
Purchase History
| Date | Buyer | Sale Price | Title Company |
|---|---|---|---|
| Mixon Elizabeth S | -- | None Available | |
| Mixon Stephen | -- | None Available | |
| Mixon Stephen | -- | None Available | |
| Mixon Elizabeth S | -- | None Availabale | |
| Mixon Stephen | $407,000 | None Availabale | |
| -- | $260,000 | -- | |
| -- | $46,000 | -- |
Source: Public Records
Mortgage History
| Date | Status | Borrower | Loan Amount |
|---|---|---|---|
| Open | Mixon Elizabeth S | $300,500 | |
| Previous Owner | Mixon Stephen | $325,600 |
Source: Public Records
Tax History Compared to Growth
Tax History
| Year | Tax Paid | Tax Assessment Tax Assessment Total Assessment is a certain percentage of the fair market value that is determined by local assessors to be the total taxable value of land and additions on the property. | Land | Improvement |
|---|---|---|---|---|
| 2025 | $5,932 | $248,410 | $30,000 | $218,410 |
| 2024 | $6,131 | $248,410 | $30,000 | $218,410 |
| 2023 | $4,019 | $215,588 | $24,000 | $191,588 |
| 2022 | $5,600 | $198,533 | $23,940 | $174,593 |
| 2021 | $7,278 | $198,533 | $23,940 | $174,593 |
| 2020 | $6,454 | $173,245 | $21,420 | $151,825 |
| 2019 | $6,373 | $169,794 | $21,420 | $148,374 |
| 2018 | $9,939 | $169,794 | $21,420 | $148,374 |
| 2017 | $5,482 | $153,308 | $21,420 | $131,888 |
| 2016 | $5,062 | $153,308 | $21,420 | $131,888 |
| 2015 | $7,165 | $153,308 | $21,420 | $131,888 |
| 2014 | $6,891 | $147,482 | $22,680 | $124,802 |
Source: Public Records
Map
Nearby Homes
- 159 Westchester Dr
- 151 Westchester Dr
- 401 Gentry Walk Unit 13
- 401 Gentry Walk
- 147 Westchester Dr
- 1695 Rivoli Ln
- 1715 Rivoli Ln
- 400 Gentry Walk
- 148 Westchester Dr
- 148 Westchester Dr Unit 264
- 143 Westchester Dr
- 1685 Rivoli Ln
- 163 Westchester Dr
- 405 Gentry Walk
- 1725 Rivoli Ln
- 144 Westchester Dr
- 404 Gentry Walk
- 409 Gentry Walk
- 140 Westchester Dr
- 408 Gentry Walk