1550 Armour Cir Elberton, GA 30635
Estimated Value: $225,818 - $303,000
2
Beds
2
Baths
1,500
Sq Ft
$176/Sq Ft
Est. Value
About This Home
This home is located at 1550 Armour Cir, Elberton, GA 30635 and is currently estimated at $264,205, approximately $176 per square foot. 1550 Armour Cir is a home located in Elbert County with nearby schools including Elbert County Primary School, Elbert County Elementary School, and Elbert County Middle School.
Ownership History
Date
Name
Owned For
Owner Type
Purchase Details
Closed on
Nov 24, 2020
Sold by
Kelly Damien
Bought by
Fay Stanley F
Current Estimated Value
Purchase Details
Closed on
Nov 1, 2020
Sold by
Meigs Denise Anne
Bought by
Fay Stanley F
Purchase Details
Closed on
Oct 20, 2008
Sold by
Fay Stanley F
Bought by
Meigs Denise Ann and Bennett Lynda Dawn
Purchase Details
Closed on
Jul 20, 2007
Sold by
Hill William W
Bought by
Staley Fay F and Staley Fay Shirleyanne
Home Financials for this Owner
Home Financials are based on the most recent Mortgage that was taken out on this home.
Original Mortgage
$85,500
Interest Rate
6.65%
Purchase Details
Closed on
Jun 14, 2004
Sold by
Holmes Jacky 3C
Bought by
Hill William W
Purchase Details
Closed on
Jun 1, 1991
Purchase Details
Closed on
Jul 1, 1984
Purchase Details
Closed on
Dec 1, 1983
Purchase Details
Closed on
Sep 1, 1978
Create a Home Valuation Report for This Property
The Home Valuation Report is an in-depth analysis detailing your home's value as well as a comparison with similar homes in the area
Home Values in the Area
Average Home Value in this Area
Purchase History
| Date | Buyer | Sale Price | Title Company |
|---|---|---|---|
| Fay Stanley F | -- | -- | |
| Fay Stanley F | -- | -- | |
| Meigs Denise Ann | -- | -- | |
| Staley Fay F | $95,000 | -- | |
| Hill William W | $5,000 | -- | |
| -- | $3,500 | -- | |
| -- | $2,200 | -- | |
| -- | -- | -- | |
| -- | -- | -- |
Source: Public Records
Mortgage History
| Date | Status | Borrower | Loan Amount |
|---|---|---|---|
| Previous Owner | Staley Fay F | $85,500 |
Source: Public Records
Tax History Compared to Growth
Tax History
| Year | Tax Paid | Tax Assessment Tax Assessment Total Assessment is a certain percentage of the fair market value that is determined by local assessors to be the total taxable value of land and additions on the property. | Land | Improvement |
|---|---|---|---|---|
| 2024 | -- | $74,669 | $6,061 | $68,608 |
| 2023 | $1,330 | $74,669 | $6,061 | $68,608 |
| 2022 | $1,330 | $47,106 | $3,608 | $43,498 |
| 2021 | $1,330 | $47,106 | $3,608 | $43,498 |
| 2020 | $973 | $35,780 | $2,886 | $32,894 |
| 2019 | $1,010 | $35,780 | $2,886 | $32,894 |
| 2018 | $1,041 | $35,780 | $2,886 | $32,894 |
| 2017 | $1,143 | $36,394 | $2,886 | $33,508 |
| 2016 | $1,057 | $36,001 | $2,886 | $33,115 |
| 2015 | -- | $36,001 | $2,886 | $33,115 |
| 2014 | -- | $36,001 | $2,886 | $33,115 |
| 2013 | -- | $36,001 | $2,886 | $33,115 |
Source: Public Records
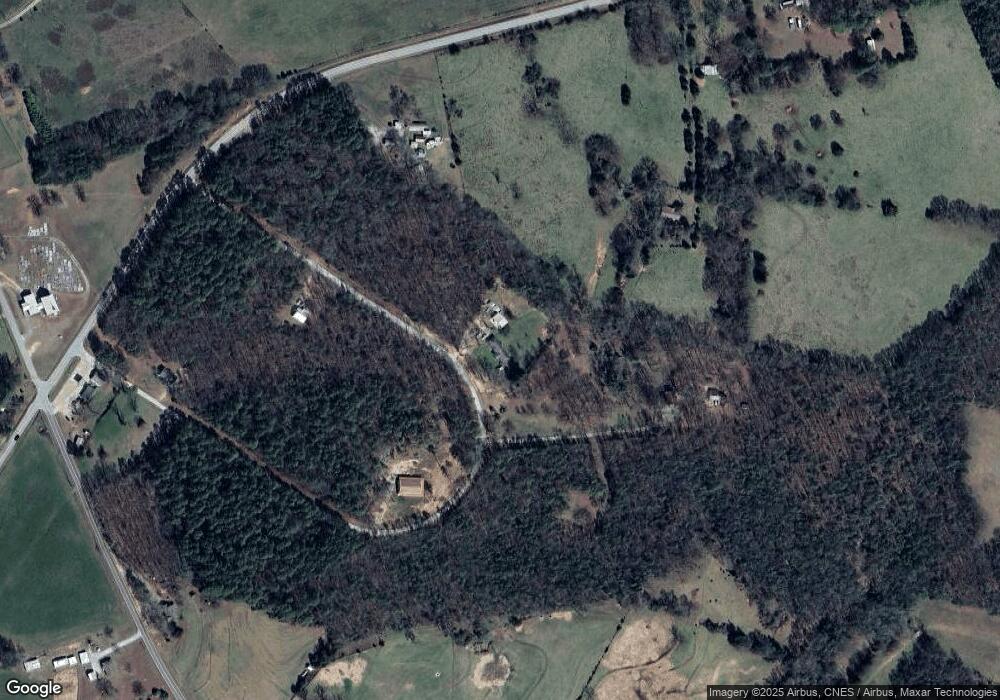
Map
Nearby Homes
- 2187 Turner Hill Rd
- 2946 Rock Branch Rd
- 0 Gregg Shoals Dr Unit 10497348
- 0 Gregg Shoals Dr Unit CL342115
- 0 Gregg Shoals Dr Unit LotWP001 24031325
- 0 Pickens Point Dr Unit CL337116
- 0 Pickens Point Dr Unit 10588711
- 1071 Sword Dr Unit 64
- 1071 Sword Dr
- 0 Omaha Dr Unit 7591330
- 0 Omaha Dr Unit 10536866
- 0 Anderson Hwy Unit 24629664
- 0 Anderson Hwy Unit 10536298
- 39B Omaha Dr
- Lot 26 Omaha Dr
- Lot 26 Omaha Dr Unit 26
- Lot 36 Omaha Dr
- 52B Omaha Dr
- 1051 Bluff Rd
- 0 Millstone Creek Rd Unit 10531895
- 25 AND 27 Rock Branch Estates
- 1531 Armour Cir
- 1540 Armour Cir
- 0000 Armour Cir
- 0 Armour Cir Unit 8650902
- 0 Armour Cir Unit LOT 29 9017887
- LOT 29 Armour Cir
- 0 Armour Cir
- 1575 Armour Cir
- 3278 Anderson Hwy
- 1513 Armour Cir
- 3569 Ruckersville Rd
- 3224 Anderson Hwy
- 3595 Ruckersville Rd
- 1536 Armour Cir
- 3344 Anderson Hwy
- 3592 Ruckersville Rd
- 3346 Anderson Hwy
- 2701 Rock Branch Rd
- 3576 Ruckersville Rd