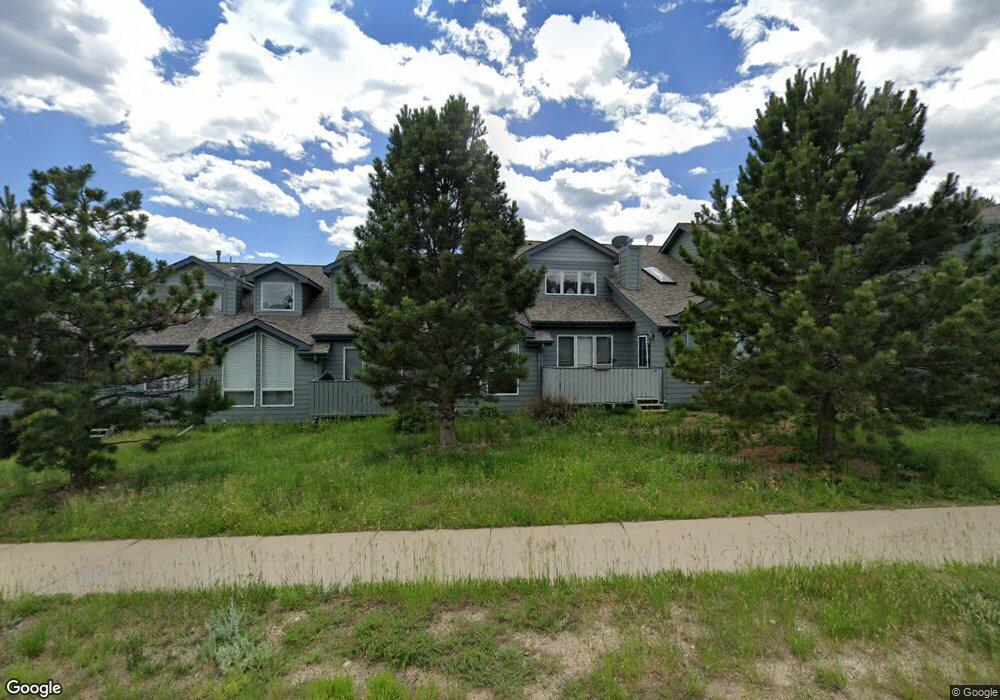
1550 Raven Cir Unit B Estes Park, CO 80517
Estimated Value: $564,000 - $627,000
3
Beds
3
Baths
1,672
Sq Ft
$353/Sq Ft
Est. Value
About This Home
This home is located at 1550 Raven Cir Unit B, Estes Park, CO 80517 and is currently estimated at $589,540, approximately $352 per square foot. 1550 Raven Cir Unit B is a home located in Larimer County with nearby schools including Estes Park K-5 School, Estes Park Options School, and Estes Park Middle School.
Ownership History
Date
Name
Owned For
Owner Type
Purchase Details
Closed on
Jul 24, 2018
Sold by
Fonken David W and Fonken Shirley M
Bought by
Fonken Paul W and Fonken Erin L
Current Estimated Value
Home Financials for this Owner
Home Financials are based on the most recent Mortgage that was taken out on this home.
Original Mortgage
$258,070
Outstanding Balance
$190,738
Interest Rate
4.5%
Mortgage Type
New Conventional
Estimated Equity
$398,802
Purchase Details
Closed on
Feb 25, 2009
Sold by
Campbell Bruce A and Estate Of Warren E Campbell
Bought by
Fonken Shirley M and Fonken David W
Home Financials for this Owner
Home Financials are based on the most recent Mortgage that was taken out on this home.
Original Mortgage
$159,000
Interest Rate
4.92%
Mortgage Type
Purchase Money Mortgage
Purchase Details
Closed on
Sep 25, 2000
Sold by
Richard H Wille Trust
Bought by
Campbell Warren E
Home Financials for this Owner
Home Financials are based on the most recent Mortgage that was taken out on this home.
Original Mortgage
$50,001
Interest Rate
7.97%
Create a Home Valuation Report for This Property
The Home Valuation Report is an in-depth analysis detailing your home's value as well as a comparison with similar homes in the area
Home Values in the Area
Average Home Value in this Area
Purchase History
| Date | Buyer | Sale Price | Title Company |
|---|---|---|---|
| Fonken Paul W | $344,095 | Rocky Mountain Title | |
| Fonken Shirley M | $245,000 | None Available | |
| Campbell Warren E | $191,400 | -- |
Source: Public Records
Mortgage History
| Date | Status | Borrower | Loan Amount |
|---|---|---|---|
| Open | Fonken Paul W | $258,070 | |
| Previous Owner | Fonken Shirley M | $159,000 | |
| Previous Owner | Campbell Warren E | $50,001 |
Source: Public Records
Tax History Compared to Growth
Tax History
| Year | Tax Paid | Tax Assessment Tax Assessment Total Assessment is a certain percentage of the fair market value that is determined by local assessors to be the total taxable value of land and additions on the property. | Land | Improvement |
|---|---|---|---|---|
| 2025 | $2,652 | $39,892 | $3,618 | $36,274 |
| 2024 | $2,607 | $39,892 | $3,618 | $36,274 |
| 2022 | $2,178 | $28,523 | $3,753 | $24,770 |
| 2021 | $2,236 | $29,344 | $3,861 | $25,483 |
| 2020 | $2,125 | $27,535 | $3,861 | $23,674 |
| 2019 | $2,114 | $27,535 | $3,861 | $23,674 |
| 2018 | $1,690 | $21,355 | $3,888 | $17,467 |
| 2017 | $1,699 | $21,355 | $3,888 | $17,467 |
| 2016 | $1,590 | $21,181 | $4,298 | $16,883 |
| 2015 | $1,607 | $21,180 | $4,300 | $16,880 |
| 2014 | $1,359 | $18,380 | $4,860 | $13,520 |
Source: Public Records
Map
Nearby Homes
- 1555 Raven Cir Unit C
- 1437 Raven Cir Unit A
- 1437 Raven Cir
- 514 Grand Estates Dr Unit 5
- 550 Grand Estates Dr
- 1820 Raven Ave
- 1680 Continental Peaks Cir
- 1690 Continental Peaks Cir
- 1665 Continental Peaks Cir
- 1700 Continental Peaks Cir
- 1750 Continental Peaks Cir
- 1760 Continental Peaks Cir
- 1768 Wildfire Rd Unit 101
- 1770 Continental Peaks Cir
- 1701 Continental Peaks Cir
- 1705 Continental Peaks Cir
- 1780 Continental Peaks Cir
- 1707 Continental Peaks Cir
- 1790 Continental Peaks Cir
- 1616 Continental Peaks Cir
- 1550 Raven Cir Unit O
- 1550 Raven Cir Unit N
- 1550 Raven Cir Unit M
- 1550 Raven Cir Unit L
- 1550 Raven Cir Unit K
- 1550 Raven Cir Unit J
- 1550 Raven Cir Unit I
- 1550 Raven Cir Unit H
- 1550 Raven Cir Unit G
- 1550 Raven Cir Unit F
- 1550 Raven Cir Unit E
- 1550 Raven Cir Unit D
- 1550 Raven Cir Unit C
- 1550 Raven Cir Unit A
- 1550 Raven Cir Unit 1
- 1550 Raven Cir
- 1550 Raven Cir
- 1555 Raven Cir Unit I
- 1555 Raven Cir Unit H
- 1555 Raven Cir Unit G