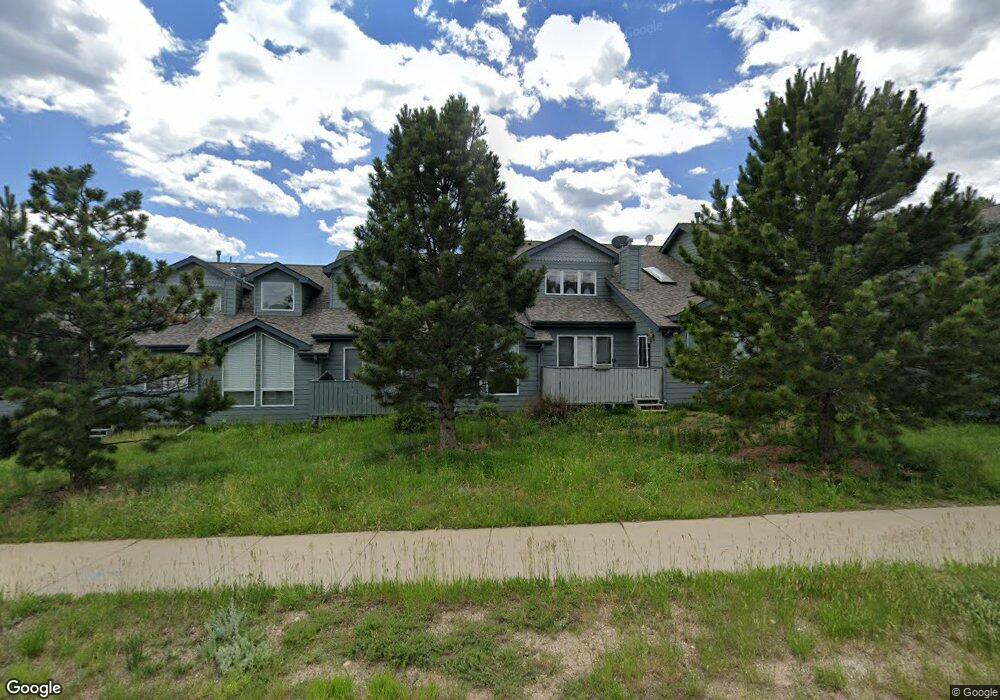
1550 Raven Cir Unit D Estes Park, CO 80517
Estimated Value: $579,000 - $659,000
3
Beds
3
Baths
1,648
Sq Ft
$370/Sq Ft
Est. Value
About This Home
This home is located at 1550 Raven Cir Unit D, Estes Park, CO 80517 and is currently estimated at $609,578, approximately $369 per square foot. 1550 Raven Cir Unit D is a home located in Larimer County with nearby schools including Estes Park K-5 School, Estes Park Options School, and Estes Park Middle School.
Ownership History
Date
Name
Owned For
Owner Type
Purchase Details
Closed on
Jun 10, 2016
Sold by
Davies Bruce W and Hills Sarah J
Bought by
Davies Sarah J
Current Estimated Value
Home Financials for this Owner
Home Financials are based on the most recent Mortgage that was taken out on this home.
Original Mortgage
$205,000
Outstanding Balance
$149,526
Interest Rate
3.61%
Mortgage Type
New Conventional
Estimated Equity
$460,052
Purchase Details
Closed on
Mar 30, 2011
Sold by
Sonner Larry W and Sonner Barbara
Bought by
Hills Sarah J and Davies Bruce W
Home Financials for this Owner
Home Financials are based on the most recent Mortgage that was taken out on this home.
Original Mortgage
$216,847
Interest Rate
4.75%
Mortgage Type
FHA
Purchase Details
Closed on
Sep 26, 2000
Sold by
Richard H Wille Trust
Bought by
Sonner Larry W and Sonner Barbara
Home Financials for this Owner
Home Financials are based on the most recent Mortgage that was taken out on this home.
Original Mortgage
$155,100
Interest Rate
7.99%
Create a Home Valuation Report for This Property
The Home Valuation Report is an in-depth analysis detailing your home's value as well as a comparison with similar homes in the area
Home Values in the Area
Average Home Value in this Area
Purchase History
| Date | Buyer | Sale Price | Title Company |
|---|---|---|---|
| Davies Sarah J | -- | None Available | |
| Hills Sarah J | $226,000 | None Available | |
| Sonner Larry W | $193,900 | -- |
Source: Public Records
Mortgage History
| Date | Status | Borrower | Loan Amount |
|---|---|---|---|
| Open | Davies Sarah J | $205,000 | |
| Closed | Hills Sarah J | $216,847 | |
| Previous Owner | Sonner Larry W | $155,100 |
Source: Public Records
Tax History Compared to Growth
Tax History
| Year | Tax Paid | Tax Assessment Tax Assessment Total Assessment is a certain percentage of the fair market value that is determined by local assessors to be the total taxable value of land and additions on the property. | Land | Improvement |
|---|---|---|---|---|
| 2025 | $2,631 | $39,610 | $3,618 | $35,992 |
| 2024 | $2,586 | $39,610 | $3,618 | $35,992 |
| 2022 | $2,162 | $28,307 | $3,753 | $24,554 |
| 2021 | $2,219 | $29,122 | $3,861 | $25,261 |
| 2020 | $2,102 | $27,227 | $3,861 | $23,366 |
| 2019 | $2,090 | $27,227 | $3,861 | $23,366 |
| 2018 | $1,673 | $21,132 | $3,888 | $17,244 |
| 2017 | $1,682 | $21,132 | $3,888 | $17,244 |
| 2016 | $1,575 | $20,974 | $4,298 | $16,676 |
| 2015 | $1,591 | $20,980 | $4,300 | $16,680 |
| 2014 | $1,345 | $18,180 | $4,860 | $13,320 |
Source: Public Records
Map
Nearby Homes
- 1555 Raven Cir Unit C
- 1437 Raven Cir Unit A
- 1437 Raven Cir
- 514 Grand Estates Dr Unit 5
- 550 Grand Estates Dr
- 1680 Continental Peaks Cir
- 1690 Continental Peaks Cir
- 1665 Continental Peaks Cir
- 1820 Raven Ave
- 1700 Continental Peaks Cir
- 1750 Continental Peaks Cir
- 1768 Wildfire Rd Unit 101
- 1760 Continental Peaks Cir
- 1701 Continental Peaks Cir
- 1770 Continental Peaks Cir
- 1705 Continental Peaks Cir
- 1707 Continental Peaks Cir
- 1780 Continental Peaks Cir
- 1616 Continental Peaks Cir
- 1720 Continental Peaks Cir
- 1550 Raven Cir Unit O
- 1550 Raven Cir Unit N
- 1550 Raven Cir Unit M
- 1550 Raven Cir Unit L
- 1550 Raven Cir Unit K
- 1550 Raven Cir Unit J
- 1550 Raven Cir Unit I
- 1550 Raven Cir Unit H
- 1550 Raven Cir Unit G
- 1550 Raven Cir Unit F
- 1550 Raven Cir Unit E
- 1550 Raven Cir Unit C
- 1550 Raven Cir Unit B
- 1550 Raven Cir Unit A
- 1550 Raven Cir Unit 1
- 1550 Raven Cir
- 1550 Raven Cir
- 1555 Raven Cir Unit I
- 1555 Raven Cir Unit H
- 1555 Raven Cir Unit G