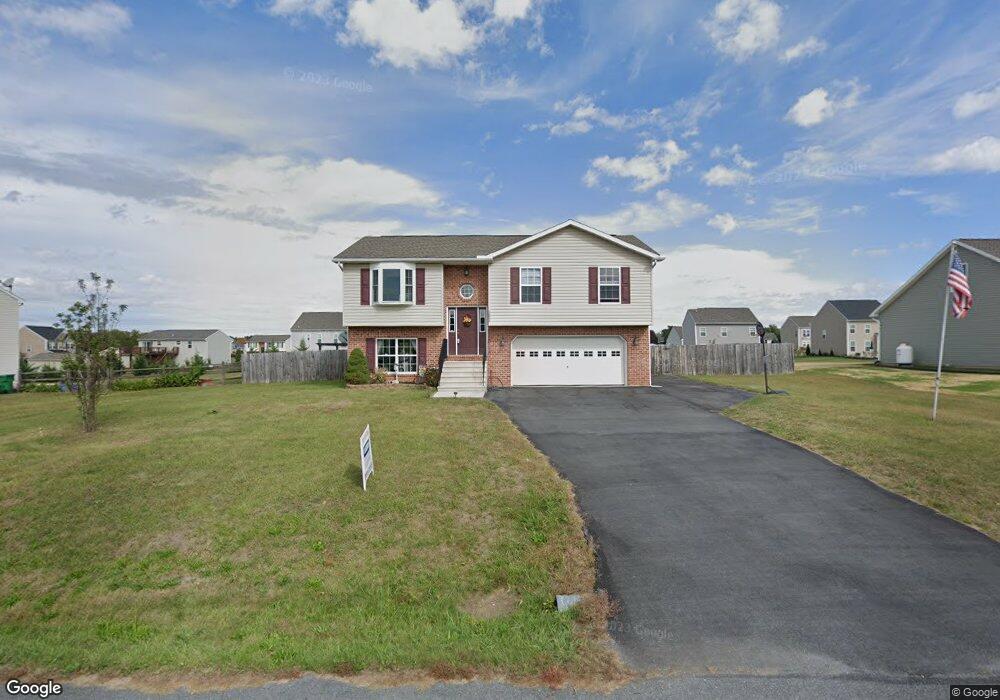
15502 Camden Dr Unit 141 Greencastle, PA 17225
Estimated Value: $279,000 - $341,000
3
Beds
2
Baths
1,175
Sq Ft
$269/Sq Ft
Est. Value
About This Home
This home is located at 15502 Camden Dr Unit 141, Greencastle, PA 17225 and is currently estimated at $316,131, approximately $269 per square foot. 15502 Camden Dr Unit 141 is a home located in Franklin County with nearby schools including Greencastle-Antrim Primary School, Greencastle-Antrim Elementary School, and Greencastle-Antrim Middle School.
Ownership History
Date
Name
Owned For
Owner Type
Purchase Details
Closed on
Nov 27, 2023
Sold by
Toms Gary A
Bought by
Toms Gary A and Toms April Marie
Current Estimated Value
Purchase Details
Closed on
Nov 19, 2019
Sold by
Nye Michael W and Nye Crystal D
Bought by
Toms Gary A and Fisher Brooke M
Home Financials for this Owner
Home Financials are based on the most recent Mortgage that was taken out on this home.
Original Mortgage
$213,560
Interest Rate
3.5%
Mortgage Type
FHA
Purchase Details
Closed on
Feb 23, 2010
Sold by
Nottingham Meadows Llc
Bought by
Nye Michael W
Home Financials for this Owner
Home Financials are based on the most recent Mortgage that was taken out on this home.
Original Mortgage
$199,000
Interest Rate
5%
Mortgage Type
VA
Create a Home Valuation Report for This Property
The Home Valuation Report is an in-depth analysis detailing your home's value as well as a comparison with similar homes in the area
Home Values in the Area
Average Home Value in this Area
Purchase History
| Date | Buyer | Sale Price | Title Company |
|---|---|---|---|
| Toms Gary A | -- | Lawyers Signature Settlements | |
| Toms Gary A | $217,500 | Title Services | |
| Nye Michael W | $199,000 | None Available |
Source: Public Records
Mortgage History
| Date | Status | Borrower | Loan Amount |
|---|---|---|---|
| Previous Owner | Toms Gary A | $213,560 | |
| Previous Owner | Nye Michael W | $199,000 |
Source: Public Records
Tax History Compared to Growth
Tax History
| Year | Tax Paid | Tax Assessment Tax Assessment Total Assessment is a certain percentage of the fair market value that is determined by local assessors to be the total taxable value of land and additions on the property. | Land | Improvement |
|---|---|---|---|---|
| 2025 | $3,804 | $22,740 | $3,520 | $19,220 |
| 2024 | $3,451 | $22,740 | $3,520 | $19,220 |
| 2023 | $3,411 | $22,740 | $3,520 | $19,220 |
| 2022 | $3,411 | $22,740 | $3,520 | $19,220 |
| 2021 | $3,344 | $22,740 | $3,520 | $19,220 |
| 2020 | $3,257 | $22,740 | $3,520 | $19,220 |
| 2019 | $3,183 | $22,740 | $3,520 | $19,220 |
| 2018 | $3,149 | $22,740 | $3,520 | $19,220 |
| 2017 | $3,070 | $22,740 | $3,520 | $19,220 |
| 2016 | $652 | $22,740 | $3,520 | $19,220 |
| 2015 | $607 | $22,740 | $3,520 | $19,220 |
| 2014 | $607 | $22,740 | $3,520 | $19,220 |
Source: Public Records
Map
Nearby Homes
- 15480 Wedgewood Dr
- 0 Hykes Rd
- 15444 Pennsylvania Ave
- Lot C3-2 Cedarbrook Dr
- Lot C3-1 Cedarbrook Dr
- 110 Hykes Rd E
- 128 Hykes Rd E
- 160 Eleahs Crossing
- 14799 Cedarbrook Dr
- 14501 Molly Pitcher Hwy
- 14732 Cedarbrook Dr
- 171 East Ave
- 226 Milnor Rd
- 642 Milnor Rd
- 1171 1173 Ridgeview Dr
- 15621 Oak Rd
- 14433 Williamsport Pike
- 1031 Dianne Dr
- 1033 Dianne Dr
- Lot # 6-36 Paradise View Dr
- 15502 Camden Dr
- 15484 Camden Dr
- 15524 Camden Dr
- 15544 Camden Dr
- 15519 Camden Dr
- 826 Bristol Dr
- 15454 Camden Dr
- 15499 Camden Dr
- 806 Bristol Dr
- 15541 Camden Dr
- 15481 Camden Dr
- Bristol Dr
- Bristol Dr
- 852 Bristol Dr
- 15601 Campden Dr
- 15576 Camden Dr
- 15561 Camden Dr
- 0 Camden Dr Unit FL10127729
- 0 Camden Dr Unit FL10127723
- 825 Bristol Dr