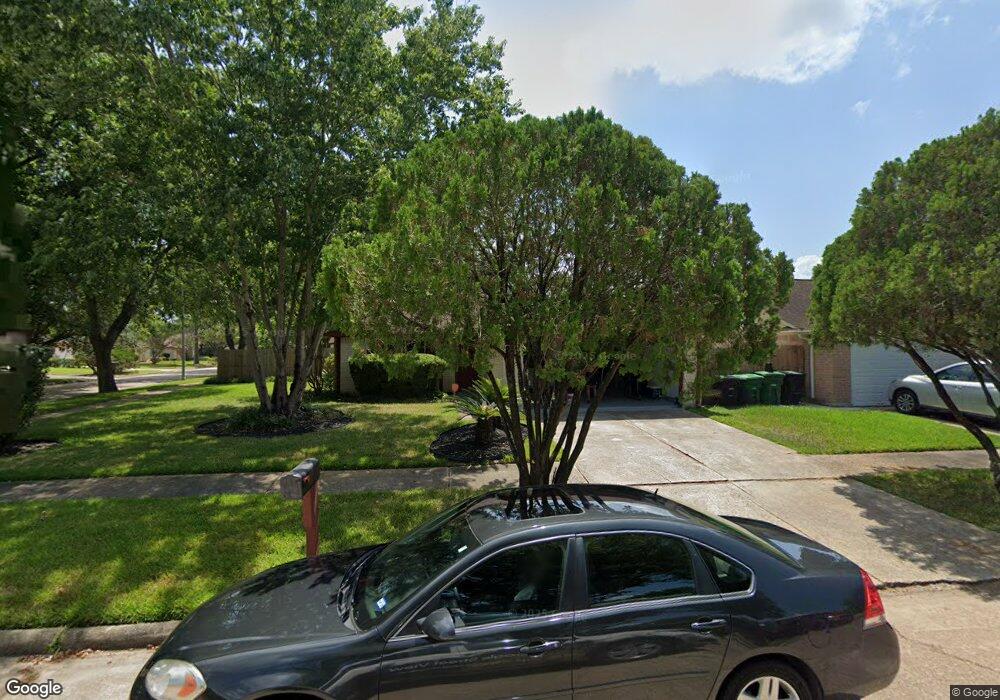
15503 Raven Trail Missouri City, TX 77489
Fort Bend Houston NeighborhoodEstimated Value: $221,894 - $237,000
3
Beds
2
Baths
1,712
Sq Ft
$133/Sq Ft
Est. Value
About This Home
This home is located at 15503 Raven Trail, Missouri City, TX 77489 and is currently estimated at $227,974, approximately $133 per square foot. 15503 Raven Trail is a home located in Fort Bend County with nearby schools including Briargate Elementary School, Blue Ridge Elementary School, and Christa McAuliffe Middle School.
Ownership History
Date
Name
Owned For
Owner Type
Purchase Details
Closed on
May 27, 2016
Sold by
Jarmon Darryl and Wilson Tyras E
Bought by
Wiley Arthur R
Current Estimated Value
Home Financials for this Owner
Home Financials are based on the most recent Mortgage that was taken out on this home.
Original Mortgage
$94,261
Outstanding Balance
$75,746
Interest Rate
3.87%
Mortgage Type
FHA
Estimated Equity
$152,228
Purchase Details
Closed on
May 4, 2016
Sold by
White Donald Ray
Bought by
Jarmon Darryl
Home Financials for this Owner
Home Financials are based on the most recent Mortgage that was taken out on this home.
Original Mortgage
$94,261
Outstanding Balance
$75,746
Interest Rate
3.87%
Mortgage Type
FHA
Estimated Equity
$152,228
Purchase Details
Closed on
Jan 26, 2016
Sold by
Dennis Kimberly C
Bought by
Jarmon Darryl
Purchase Details
Closed on
Nov 15, 2014
Sold by
Wilson Louise J
Bought by
Wiley Arthur R
Create a Home Valuation Report for This Property
The Home Valuation Report is an in-depth analysis detailing your home's value as well as a comparison with similar homes in the area
Home Values in the Area
Average Home Value in this Area
Purchase History
| Date | Buyer | Sale Price | Title Company |
|---|---|---|---|
| Wiley Arthur R | -- | Stewart Title | |
| Jarmon Darryl | -- | Stewart Title | |
| Jarmon Darryl | -- | Stewart Title | |
| Wiley Arthur R | -- | -- |
Source: Public Records
Mortgage History
| Date | Status | Borrower | Loan Amount |
|---|---|---|---|
| Open | Wiley Arthur R | $94,261 |
Source: Public Records
Tax History Compared to Growth
Tax History
| Year | Tax Paid | Tax Assessment Tax Assessment Total Assessment is a certain percentage of the fair market value that is determined by local assessors to be the total taxable value of land and additions on the property. | Land | Improvement |
|---|---|---|---|---|
| 2025 | $1,447 | $211,164 | $68,900 | $142,264 |
| 2024 | $1,447 | $223,075 | $68,900 | $154,175 |
| 2023 | $4,506 | $231,420 | $53,000 | $178,420 |
| 2022 | $4,505 | $212,540 | $39,000 | $173,540 |
| 2021 | $3,392 | $153,240 | $26,500 | $126,740 |
| 2020 | $3,144 | $139,390 | $26,500 | $112,890 |
| 2019 | $3,192 | $134,560 | $26,500 | $108,060 |
| 2018 | $2,871 | $120,970 | $21,500 | $99,470 |
| 2017 | $2,680 | $111,650 | $21,500 | $90,150 |
| 2016 | $2,254 | $93,880 | $21,500 | $72,380 |
| 2015 | $1,531 | $83,840 | $21,500 | $62,340 |
| 2014 | $737 | $54,040 | $21,500 | $32,540 |
Source: Public Records
Map
Nearby Homes
- 15615 Raven Trail
- 15610 Briar Spring Ct
- 6618 Castleview Ln
- 6619 Indian Lake Dr
- 15734 Briargate Ct
- 15770 Chimney Rock Rd
- 15806 Corsair Rd
- 6814 Indian Falls Dr
- 15318 Corsair Rd
- 6734 Indian Lake Dr
- 15823 Kueben Ln
- 6626 Roberson St
- 6101 Maywood Dr
- 6911 Briargate Dr
- 0 Brooklawn Dr Unit 98139376
- 6918 Thornwild Rd
- 6835 Laughlin Dr
- 6623 Maczali Dr
- 7022 Castleview Ln
- 6618 Trigate Dr
- 15507 Raven Trail
- 15502 Rose Ridge Ct
- 15506 Rose Ridge Ct
- 15511 Raven Trail
- 15510 Rose Ridge Ct
- 6422 Summer Ridge Dr
- 6418 Summer Ridge Dr
- 15502 Raven Trail
- 6426 Summer Ridge Dr
- 6414 Summer Ridge Dr
- 15506 Raven Trail
- 15515 Raven Trail
- 15514 Rose Ridge Ct
- 6410 Summer Ridge Dr
- 6430 Summer Ridge Dr
- 15510 Raven Trail
- 15519 Raven Trail
- 15518 Rose Ridge Ct
- 6423 Bazel Brook Dr
- 6503 Summer Ridge Dr