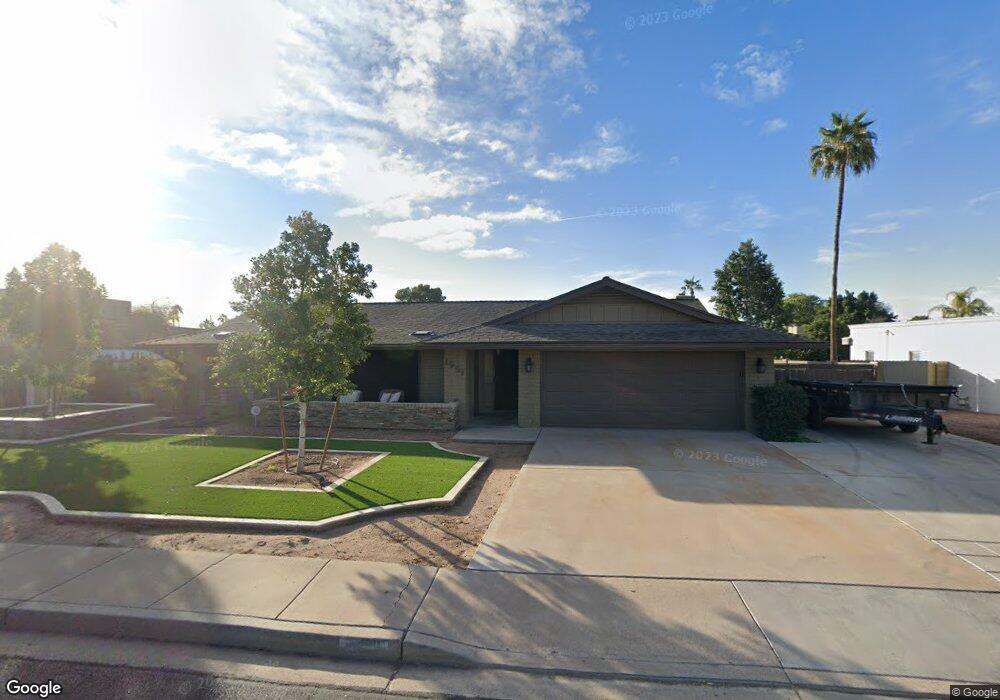
1551 E Gary St Mesa, AZ 85203
North Central Mesa NeighborhoodEstimated Value: $468,948 - $545,000
3
Beds
2
Baths
2,183
Sq Ft
$240/Sq Ft
Est. Value
About This Home
This home is located at 1551 E Gary St, Mesa, AZ 85203 and is currently estimated at $523,737, approximately $239 per square foot. 1551 E Gary St is a home located in Maricopa County with nearby schools including Macarthur Elementary School, Franklin at Brimhall Elementary School, and Franklin West Elementary School.
Ownership History
Date
Name
Owned For
Owner Type
Purchase Details
Closed on
Sep 26, 2022
Sold by
Drew Williams
Bought by
Williams Drew
Current Estimated Value
Purchase Details
Closed on
Mar 10, 2006
Sold by
Stewart Wesley D and Stewart Donna L
Bought by
Hammock Andrew J
Home Financials for this Owner
Home Financials are based on the most recent Mortgage that was taken out on this home.
Original Mortgage
$256,000
Interest Rate
6.25%
Mortgage Type
New Conventional
Purchase Details
Closed on
May 4, 1998
Sold by
Minor Richard E and Kerr Minor Deborah J
Bought by
Stewart Wesley and Stewart Donna
Home Financials for this Owner
Home Financials are based on the most recent Mortgage that was taken out on this home.
Original Mortgage
$125,400
Interest Rate
7.05%
Mortgage Type
New Conventional
Purchase Details
Closed on
Mar 23, 1995
Sold by
Minor Richard E and Kerr Minor Deborah J
Bought by
Minor Richard E and Kerr Minor Deborah J
Create a Home Valuation Report for This Property
The Home Valuation Report is an in-depth analysis detailing your home's value as well as a comparison with similar homes in the area
Home Values in the Area
Average Home Value in this Area
Purchase History
| Date | Buyer | Sale Price | Title Company |
|---|---|---|---|
| Williams Drew | -- | -- | |
| Hammock Andrew J | $320,000 | Tsa Title Agency | |
| Stewart Wesley | $132,000 | Security Title Agency | |
| Minor Richard E | -- | -- |
Source: Public Records
Mortgage History
| Date | Status | Borrower | Loan Amount |
|---|---|---|---|
| Previous Owner | Hammock Andrew J | $256,000 | |
| Previous Owner | Stewart Wesley | $125,400 |
Source: Public Records
Tax History
| Year | Tax Paid | Tax Assessment Tax Assessment Total Assessment is a certain percentage of the fair market value that is determined by local assessors to be the total taxable value of land and additions on the property. | Land | Improvement |
|---|---|---|---|---|
| 2025 | $1,984 | $23,893 | -- | -- |
| 2024 | $2,006 | $22,756 | -- | -- |
| 2023 | $2,006 | $39,370 | $7,870 | $31,500 |
| 2022 | $1,962 | $30,770 | $6,150 | $24,620 |
| 2021 | $2,016 | $28,350 | $5,670 | $22,680 |
| 2020 | $1,989 | $26,600 | $5,320 | $21,280 |
| 2019 | $1,842 | $24,410 | $4,880 | $19,530 |
| 2018 | $1,759 | $22,460 | $4,490 | $17,970 |
| 2017 | $1,704 | $21,810 | $4,360 | $17,450 |
| 2016 | $1,673 | $21,410 | $4,280 | $17,130 |
| 2015 | $1,580 | $18,620 | $3,720 | $14,900 |
Source: Public Records
Map
Nearby Homes
- 1625 E Greenway St
- 1650 E Grandview St
- 1701 E Greenway St
- 1524 E Fairbrook St
- 1105 N Delmar
- 1004 North Forest Unit 56
- 1304 E Hackamore St
- 1232 E Granada St
- 1905 E Gary St
- 1324 E Hale St
- 1365 N Diane Cir
- 1204 E Glencove Cir
- 1202 E Greenway Cir
- 1714 E Indigo St
- 1825 E Elmwood St
- 1550 N Stapley Dr Unit 15
- 1550 N Stapley Dr Unit 48
- 1762 N Barkley
- 823 N Hill Cir
- 1116 E Hackamore St
- 1559 E Gary St
- 1541 E Gary St
- 1552 E Glencove St
- 1560 E Glencove St
- 1544 E Glencove St
- 1552 E Gary St
- 1529 E Gary St
- 1558 E Gary St
- 1542 E Gary St
- 1534 E Gary St
- 1607 E Gary St
- 1519 E Gary St
- 1528 E Gary St
- 1551 E Grandview St
- 1610 E Glencove St
- 1559 E Glencove St
- 1557 E Grandview St
- 1541 E Grandview St
- 1608 E Gary St
- 1532 E Glencove St
Your Personal Tour Guide
Ask me questions while you tour the home.