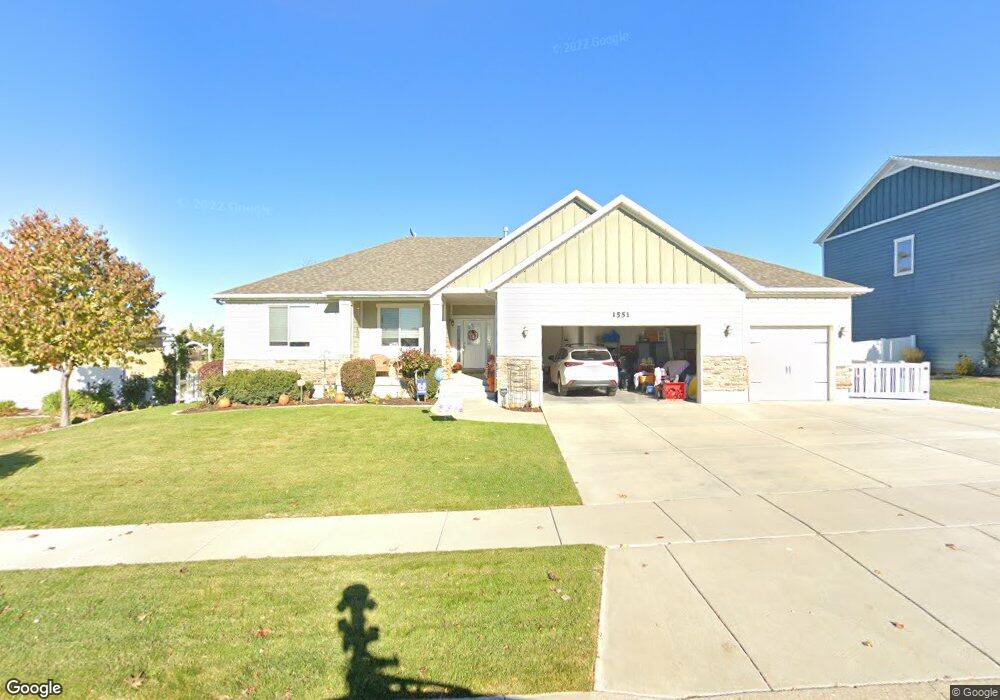
1551 E Maple Way Layton, UT 84040
Estimated Value: $680,000 - $797,035
--
Bed
4
Baths
2,020
Sq Ft
$364/Sq Ft
Est. Value
About This Home
This home is located at 1551 E Maple Way, Layton, UT 84040 and is currently estimated at $734,759, approximately $363 per square foot. 1551 E Maple Way is a home with nearby schools including Creekside Elementary School, Fairfield Junior High School, and Layton High School.
Ownership History
Date
Name
Owned For
Owner Type
Purchase Details
Closed on
Dec 1, 2017
Sold by
Bauman Fred C and Bauman Toni R
Bought by
Bauman Fred C and Bauman Family Trust
Current Estimated Value
Purchase Details
Closed on
Jun 10, 2013
Sold by
Candlelight Homes Llc
Bought by
Bauman Fred C and Bauman Toni R
Home Financials for this Owner
Home Financials are based on the most recent Mortgage that was taken out on this home.
Original Mortgage
$311,932
Interest Rate
3.37%
Mortgage Type
New Conventional
Purchase Details
Closed on
Mar 8, 2013
Sold by
Floripa Llc
Bought by
Candlelight Homes Llc
Home Financials for this Owner
Home Financials are based on the most recent Mortgage that was taken out on this home.
Original Mortgage
$305,300
Interest Rate
3.4%
Mortgage Type
Construction
Purchase Details
Closed on
Sep 13, 2012
Sold by
Penelope Rose Llc
Bought by
Floripa Llc
Purchase Details
Closed on
Sep 4, 2012
Sold by
Sli Commercial Real Estate Co and Gailey John B
Bought by
Penelope Rose Llc
Create a Home Valuation Report for This Property
The Home Valuation Report is an in-depth analysis detailing your home's value as well as a comparison with similar homes in the area
Home Values in the Area
Average Home Value in this Area
Purchase History
| Date | Buyer | Sale Price | Title Company |
|---|---|---|---|
| Bauman Fred C | -- | -- | |
| Bauman Fred C | -- | Advanced Title Ins Ag | |
| Candlelight Homes Llc | -- | Advanced Title Ins | |
| Floripa Llc | -- | First American Title | |
| Penelope Rose Llc | -- | Bonneville Superior T |
Source: Public Records
Mortgage History
| Date | Status | Borrower | Loan Amount |
|---|---|---|---|
| Previous Owner | Bauman Fred C | $311,932 | |
| Previous Owner | Candlelight Homes Llc | $305,300 |
Source: Public Records
Tax History
| Year | Tax Paid | Tax Assessment Tax Assessment Total Assessment is a certain percentage of the fair market value that is determined by local assessors to be the total taxable value of land and additions on the property. | Land | Improvement |
|---|---|---|---|---|
| 2025 | $4,040 | $424,050 | $129,202 | $294,848 |
| 2024 | $4,047 | $427,900 | $152,197 | $275,703 |
| 2023 | $4,029 | $751,000 | $203,420 | $547,580 |
| 2022 | $4,277 | $432,850 | $109,271 | $323,579 |
| 2021 | $3,948 | $596,000 | $166,551 | $429,449 |
| 2020 | $3,287 | $476,000 | $135,858 | $340,142 |
| 2019 | $3,159 | $448,000 | $121,146 | $326,854 |
| 2018 | $2,943 | $419,000 | $95,086 | $323,914 |
| 2016 | $2,882 | $211,695 | $65,242 | $146,453 |
| 2015 | $2,836 | $197,780 | $65,242 | $132,538 |
| 2014 | $2,738 | $195,235 | $65,242 | $129,993 |
| 2013 | -- | $61,383 | $61,383 | $0 |
Source: Public Records
Map
Nearby Homes
- 1368 E 275 S
- 1137 Holmes Creek Ln
- 1328 E Orchard Ridge Ln
- 1515 E Gentile St
- 1690 E Gentile St
- 187 N Talbot Dr
- 479 N 1375 E
- 1503 E 530 N
- 150 E 600 N Unit 5
- 150 E 600 N Unit 18
- 772 N Crimson Ln
- 9 Colonial Ave
- 766 N Stonne Ln
- 679 S Clearwater Falls Dr
- 285 E 500 N Unit 102
- 2382 Summerwood Dr
- 2877 E Gentile St Unit 2
- 425 E 500 N
- 815 E Oxford Dr
- 508 N Adamswood Rd
- 1583 E Maple Way
- 1535 E Maple Way
- 1593 E Maple Way
- 1562 E Maple Way
- 1578 E Maple Way
- 1578 E Maple Way Unit 409
- 1519 E Maple Way
- 272 S Bing Cherry Way
- 1603 E Maple Way
- 285 S Bing Cherry Way
- 1526 E Maple Way
- 1615 E Maple Way
- 286 N 1550 E
- 1505 E Maple Way
- 270 S 1600 E
- 301 S Bing Cherry Way
- 281 S Peachtree Cove
- 1616 E Maple Way Unit 426
- 1616 E Maple Way
- 281 S Peach Tree Cove
Your Personal Tour Guide
Ask me questions while you tour the home.