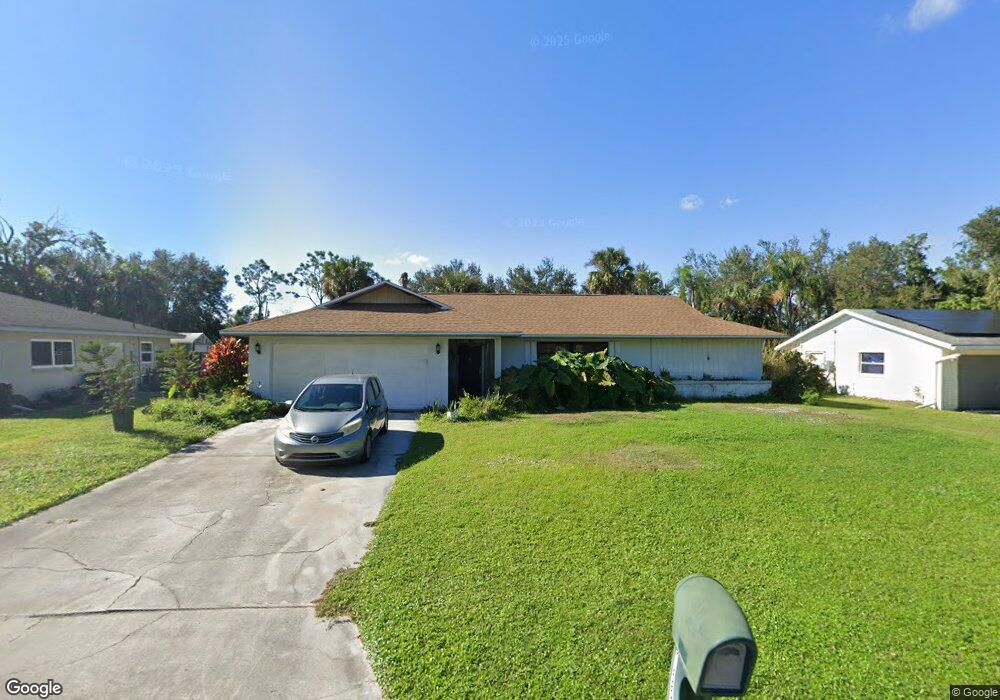
1551 Sunkist Way Fort Myers, FL 33905
Morse Shores NeighborhoodEstimated Value: $264,222 - $306,000
3
Beds
2
Baths
1,458
Sq Ft
$196/Sq Ft
Est. Value
About This Home
This home is located at 1551 Sunkist Way, Fort Myers, FL 33905 and is currently estimated at $286,306, approximately $196 per square foot. 1551 Sunkist Way is a home located in Lee County with nearby schools including Orange River Elementary School, Tice Elementary School, and Edgewood Academy.
Ownership History
Date
Name
Owned For
Owner Type
Purchase Details
Closed on
Nov 30, 2006
Sold by
Roberts Derek G and Allen Roberts Talli
Bought by
Bedinotti John and Bedinotti Gail
Current Estimated Value
Home Financials for this Owner
Home Financials are based on the most recent Mortgage that was taken out on this home.
Original Mortgage
$152,000
Outstanding Balance
$90,978
Interest Rate
6.33%
Mortgage Type
Unknown
Estimated Equity
$195,328
Purchase Details
Closed on
Jul 20, 2004
Sold by
Best Robert M and Best Catherine L
Bought by
Roberts Derek G and Allen Roberts Talli
Home Financials for this Owner
Home Financials are based on the most recent Mortgage that was taken out on this home.
Original Mortgage
$138,400
Interest Rate
5.96%
Mortgage Type
Unknown
Purchase Details
Closed on
Jun 29, 1999
Sold by
Rambo Mark A and Rambo Deborah L
Bought by
Best Robert M
Home Financials for this Owner
Home Financials are based on the most recent Mortgage that was taken out on this home.
Original Mortgage
$77,600
Interest Rate
7.27%
Create a Home Valuation Report for This Property
The Home Valuation Report is an in-depth analysis detailing your home's value as well as a comparison with similar homes in the area
Home Values in the Area
Average Home Value in this Area
Purchase History
| Date | Buyer | Sale Price | Title Company |
|---|---|---|---|
| Bedinotti John | $190,000 | Progressive Title Inc | |
| Roberts Derek G | $173,000 | Platinum Land Title Agency I | |
| Best Robert M | $97,500 | -- |
Source: Public Records
Mortgage History
| Date | Status | Borrower | Loan Amount |
|---|---|---|---|
| Open | Bedinotti John | $152,000 | |
| Previous Owner | Roberts Derek G | $138,400 | |
| Previous Owner | Best Robert M | $77,600 | |
| Closed | Roberts Derek G | $34,600 |
Source: Public Records
Tax History Compared to Growth
Tax History
| Year | Tax Paid | Tax Assessment Tax Assessment Total Assessment is a certain percentage of the fair market value that is determined by local assessors to be the total taxable value of land and additions on the property. | Land | Improvement |
|---|---|---|---|---|
| 2025 | $3,366 | $211,238 | $41,183 | $169,789 |
| 2024 | $3,368 | $248,358 | $13,874 | $234,095 |
| 2023 | $3,368 | $246,961 | $16,726 | $229,969 |
| 2022 | $3,074 | $162,193 | $0 | $0 |
| 2021 | $2,527 | $148,079 | $17,488 | $130,591 |
| 2020 | $2,334 | $134,044 | $17,300 | $116,744 |
| 2019 | $2,235 | $132,428 | $17,000 | $115,428 |
| 2018 | $2,106 | $123,550 | $17,000 | $106,550 |
| 2017 | $2,080 | $129,190 | $14,250 | $114,940 |
| 2016 | $1,960 | $123,163 | $14,400 | $108,763 |
| 2015 | $1,658 | $93,401 | $13,808 | $79,593 |
| 2014 | $1,624 | $99,305 | $13,820 | $85,485 |
| 2013 | -- | $80,211 | $13,096 | $67,115 |
Source: Public Records
Map
Nearby Homes
- 1621 Sunkist Way
- 335 Ottumwa Ave
- 4098 Peaceful River Ln
- 4086 Peaceful River Ln
- 4080 Peaceful River Ln
- CALI Plan at Brighton Pointe
- LAKESIDE Plan at Brighton Pointe
- ARIA Plan at Brighton Pointe
- BOARDWALK Plan at Brighton Pointe
- 4111 Peaceful River Ln
- 4123 Peaceful River Ln
- 13491 Sabal Ln
- 5558 Palm Beach Blvd Unit 325
- 5558 Palm Beach Blvd Unit 283
- 5558 Palm Beach Blvd Unit 35
- 5558 Palm Beach Blvd Unit 214
- 5558 Palm Beach Blvd Unit 249
- 5558 Palm Beach Blvd Unit 25
- 13431 Sabal Ln
- 399 S Buell Dr Unit 24
- 1543 Sunkist Way
- 1559 Sunkist Way
- 1567 Sunkist Way
- 4547 Mineola Ct
- 1535 Sunkist Way
- 4548 Orange Tree Ct
- 1629 Sunkist Way
- 1534 Sunkist Way
- 4557 Mineola Ct
- 1521 Sunkist Way
- 1583 Sunkist Way
- 4497 Little River Ln
- 4567 Mineola Ct
- 4568 Orange Tree Ct
- 1515 Sunkist Way
- 1591 Sunkist Way
- 4568 Mineola Ct
- 4501 Little River Ln
- 4548 Oak Tree Ct
- 4567 Orange Tree Ct