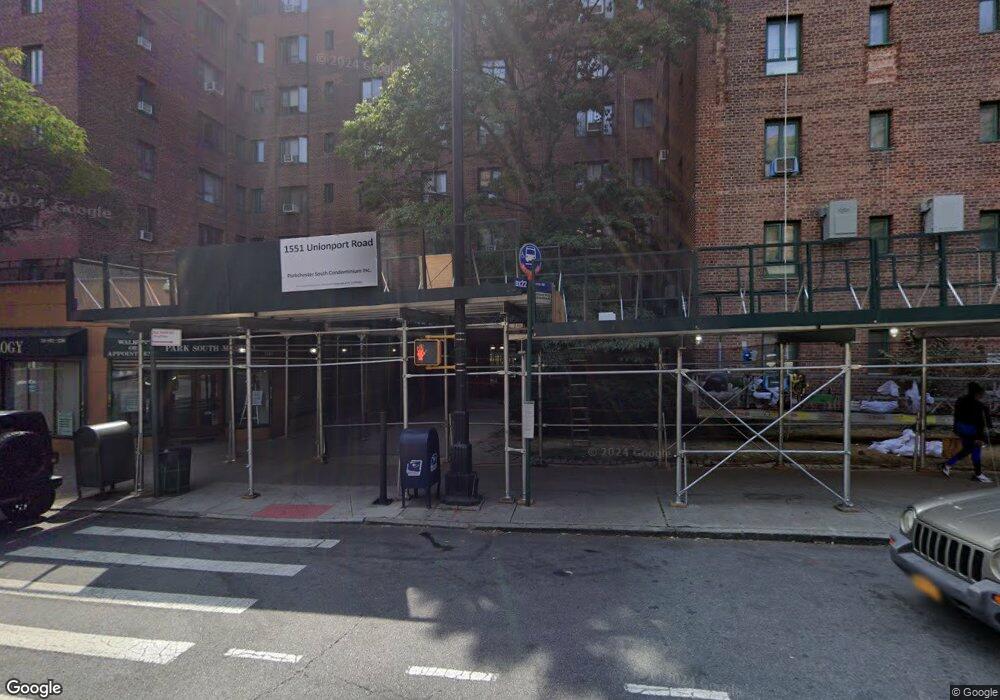
1551 Unionport Rd Unit 11E Bronx, NY 10462
Parkchester NeighborhoodEstimated Value: $217,247 - $251,000
1
Bed
1
Bath
700
Sq Ft
$339/Sq Ft
Est. Value
About This Home
This home is located at 1551 Unionport Rd Unit 11E, Bronx, NY 10462 and is currently estimated at $237,312, approximately $339 per square foot. 1551 Unionport Rd Unit 11E is a home located in Bronx County with nearby schools including P.S. 106 - Parkchester, M.S. 127 - The Castle Hill Middle School, and St Raymond Elementary School.
Ownership History
Date
Name
Owned For
Owner Type
Purchase Details
Closed on
Mar 17, 2011
Sold by
Aouissaoui Yamina
Bought by
Chung Chi Ki Victor and Tam Sin-Ying Winnie
Current Estimated Value
Purchase Details
Closed on
Jul 21, 2010
Sold by
Federal Home Loan Mortgage Corporation
Bought by
Aouissaoui Yamina
Purchase Details
Closed on
Feb 9, 2009
Sold by
Farrell Brian J Esq
Bought by
Federal Home Loan Mortgage Corporation
Purchase Details
Closed on
Jan 4, 2007
Sold by
Chowdhury Dilruba and Chowdhury Fazlul H
Bought by
Rahman Maksud
Home Financials for this Owner
Home Financials are based on the most recent Mortgage that was taken out on this home.
Original Mortgage
$123,600
Interest Rate
6.22%
Mortgage Type
Purchase Money Mortgage
Purchase Details
Closed on
Jan 22, 2001
Sold by
Saraiya Dipak and Saraiya Amishi D
Bought by
Islam Muhammad Fakhrul
Create a Home Valuation Report for This Property
The Home Valuation Report is an in-depth analysis detailing your home's value as well as a comparison with similar homes in the area
Home Values in the Area
Average Home Value in this Area
Purchase History
| Date | Buyer | Sale Price | Title Company |
|---|---|---|---|
| Chung Chi Ki Victor | $100,000 | -- | |
| Aouissaoui Yamina | $70,700 | -- | |
| Federal Home Loan Mortgage Corporation | $131,536 | -- | |
| Rahman Maksud | $123,000 | -- | |
| Islam Muhammad Fakhrul | $20,900 | Commonwealth Land Title Ins |
Source: Public Records
Mortgage History
| Date | Status | Borrower | Loan Amount |
|---|---|---|---|
| Previous Owner | Rahman Maksud | $123,600 |
Source: Public Records
Tax History Compared to Growth
Tax History
| Year | Tax Paid | Tax Assessment Tax Assessment Total Assessment is a certain percentage of the fair market value that is determined by local assessors to be the total taxable value of land and additions on the property. | Land | Improvement |
|---|---|---|---|---|
| 2025 | $655 | $26,471 | $609 | $25,862 |
| 2024 | $655 | $27,411 | $609 | $26,802 |
| 2023 | $379 | $28,365 | $609 | $27,756 |
| 2022 | $639 | $27,048 | $609 | $26,439 |
| 2021 | $643 | $24,473 | $609 | $23,864 |
| 2020 | $349 | $28,292 | $609 | $27,683 |
| 2019 | $576 | $27,968 | $609 | $27,359 |
| 2018 | $666 | $27,347 | $609 | $26,738 |
| 2017 | $666 | $26,796 | $610 | $26,186 |
| 2016 | $675 | $24,703 | $610 | $24,093 |
| 2015 | $563 | $23,390 | $610 | $22,780 |
| 2014 | $563 | $23,367 | $610 | $22,757 |
Source: Public Records
Map
Nearby Homes
- 1540 Unionport Rd Unit 7F
- 1554 Unionport Rd Unit 3B
- 1553 Unionport Rd Unit 7F
- 1555 Unionport Rd Unit 7B
- 34 Metropolitan Oval Unit 8C
- 34 Metropolitan Oval Unit 1H
- 22 Metropolitan Oval Unit 7C
- 2061 Saint Raymond Ave Unit 4A
- 1521 Unionport Rd Unit 11G
- 40 Metropolitan Oval Unit 1C
- 2055 Mcgraw Ave Unit 4G
- 2059 Mcgraw Ave Unit 6A
- 2049 Mcgraw Ave Unit 6H
- 1470 East Ave Unit 5G
- 1440 East Ave Unit 6B
- 1560 Metropolitan Ave Unit ME
- 1604 Metropolitan Ave Unit 9G
- 1604 Metropolitan Ave Unit 12G
- 1949 Mcgraw Ave Unit 7F
- 89 Metropolitan Oval Unit 7B
- 1551 Unionport Rd Unit ME
- 1551 Unionport Rd Unit MD
- 1551 Unionport Rd Unit MA
- 1551 Unionport Rd Unit TE
- 1551 Unionport Rd Unit TD
- 1551 Unionport Rd Unit 12H
- 1551 Unionport Rd Unit 12G
- 1551 Unionport Rd Unit 12F
- 1551 Unionport Rd Unit 12E
- 1551 Unionport Rd Unit 12D
- 1551 Unionport Rd Unit 12C
- 1551 Unionport Rd Unit 12B
- 1551 Unionport Rd Unit 12A
- 1551 Unionport Rd Unit 11H
- 1551 Unionport Rd Unit 11G
- 1551 Unionport Rd Unit 11F
- 1551 Unionport Rd Unit 11D
- 1551 Unionport Rd Unit 11C
- 1551 Unionport Rd Unit 11B
- 1551 Unionport Rd Unit 11A