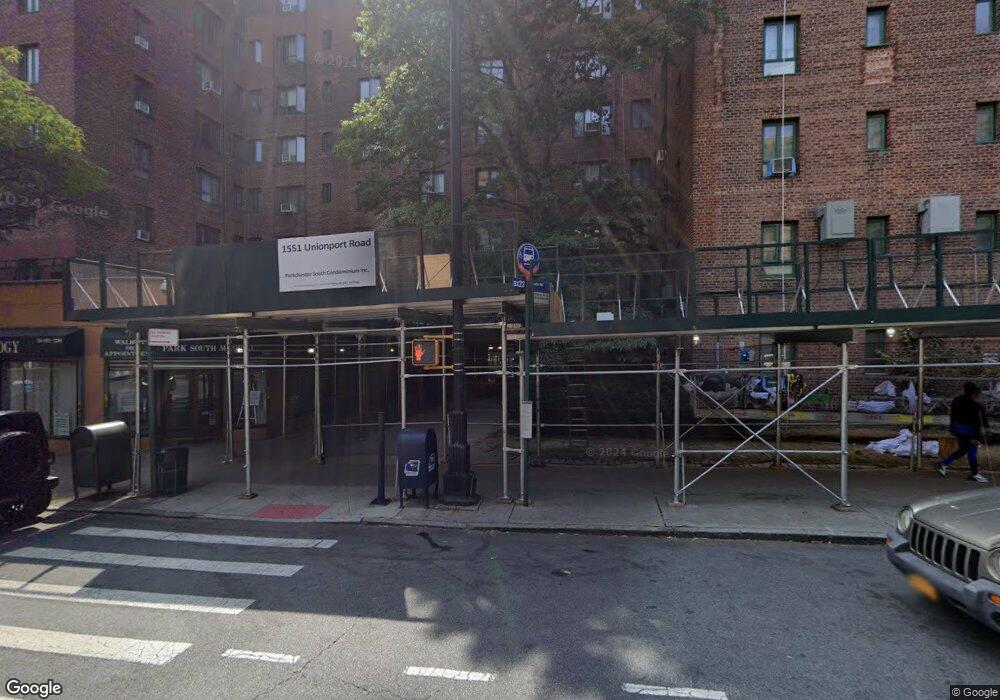
1551 Unionport Rd Unit 12D Bronx, NY 10462
Parkchester NeighborhoodEstimated Value: $242,398 - $306,000
--
Bed
--
Bath
851
Sq Ft
$333/Sq Ft
Est. Value
About This Home
This home is located at 1551 Unionport Rd Unit 12D, Bronx, NY 10462 and is currently estimated at $283,600, approximately $333 per square foot. 1551 Unionport Rd Unit 12D is a home located in Bronx County with nearby schools including P.S. 106 - Parkchester, M.S. 127 - The Castle Hill Middle School, and St Raymond Elementary School.
Ownership History
Date
Name
Owned For
Owner Type
Purchase Details
Closed on
Sep 13, 2006
Sold by
Nawal Realty Inc
Bought by
Garcia Robert
Current Estimated Value
Home Financials for this Owner
Home Financials are based on the most recent Mortgage that was taken out on this home.
Original Mortgage
$66,000
Outstanding Balance
$39,462
Interest Rate
6.59%
Mortgage Type
Purchase Money Mortgage
Estimated Equity
$244,138
Purchase Details
Closed on
Jul 14, 2005
Sold by
Dinatale Guillermo
Bought by
Nawal Realty Inc
Purchase Details
Closed on
Oct 10, 2003
Sold by
Mathew Mathew M M and Mathew Rachelamma
Bought by
Dinatale Guillermo
Home Financials for this Owner
Home Financials are based on the most recent Mortgage that was taken out on this home.
Original Mortgage
$37,600
Interest Rate
5.81%
Mortgage Type
Purchase Money Mortgage
Purchase Details
Closed on
Dec 1, 1995
Sold by
Greenpoint Bank
Bought by
Mathew Mathew M M and Mathew Rachelamma
Create a Home Valuation Report for This Property
The Home Valuation Report is an in-depth analysis detailing your home's value as well as a comparison with similar homes in the area
Home Values in the Area
Average Home Value in this Area
Purchase History
| Date | Buyer | Sale Price | Title Company |
|---|---|---|---|
| Garcia Robert | $110,000 | -- | |
| Nawal Realty Inc | $64,000 | -- | |
| Dinatale Guillermo | $47,000 | -- | |
| Mathew Mathew M M | $15,000 | Ticor Title Guarantee Compan |
Source: Public Records
Mortgage History
| Date | Status | Borrower | Loan Amount |
|---|---|---|---|
| Open | Garcia Robert | $66,000 | |
| Previous Owner | Dinatale Guillermo | $37,600 |
Source: Public Records
Tax History Compared to Growth
Tax History
| Year | Tax Paid | Tax Assessment Tax Assessment Total Assessment is a certain percentage of the fair market value that is determined by local assessors to be the total taxable value of land and additions on the property. | Land | Improvement |
|---|---|---|---|---|
| 2025 | $668 | $26,986 | $621 | $26,365 |
| 2024 | $668 | $27,944 | $621 | $27,323 |
| 2023 | $668 | $28,916 | $621 | $28,295 |
| 2022 | $652 | $27,573 | $621 | $26,952 |
| 2021 | $655 | $24,948 | $621 | $24,327 |
| 2020 | $580 | $28,841 | $621 | $28,220 |
| 2019 | $581 | $28,510 | $621 | $27,889 |
| 2018 | $679 | $27,878 | $621 | $27,257 |
| 2017 | $679 | $27,315 | $621 | $26,694 |
| 2016 | $688 | $25,182 | $621 | $24,561 |
| 2015 | $574 | $23,843 | $620 | $23,223 |
| 2014 | $574 | $23,820 | $620 | $23,200 |
Source: Public Records
Map
Nearby Homes
- 1540 Unionport Rd Unit 7F
- 1554 Unionport Rd Unit 3B
- 1545 Unionport Rd Unit 6B
- 1553 Unionport Rd Unit 7F
- 34 Metropolitan Oval Unit 8C
- 34 Metropolitan Oval Unit 1H
- 22 Metropolitan Oval Unit 7C
- 1521 Unionport Rd Unit 11G
- 1450 Parkchester Rd Unit 3H
- 18 Metropolitan Oval Unit 8A
- 18 Metropolitan Oval Unit 3C
- 2075 Saint Raymond Ave Unit 5H
- 20 Metropolitan Oval Unit 11A
- 1470 East Ave Unit 5G
- 1504 Metropolitan Ave Unit ME
- 1560 Metropolitan Ave Unit ME
- 1604 Metropolitan Ave Unit 12G
- 1949 Mcgraw Ave Unit 7F
- 89 Metropolitan Oval Unit 7B
- 2012 Benedict Ave
- 1551 Unionport Rd Unit ME
- 1551 Unionport Rd Unit MD
- 1551 Unionport Rd Unit MA
- 1551 Unionport Rd Unit TE
- 1551 Unionport Rd Unit TD
- 1551 Unionport Rd Unit 12H
- 1551 Unionport Rd Unit 12G
- 1551 Unionport Rd Unit 12F
- 1551 Unionport Rd Unit 12E
- 1551 Unionport Rd Unit 12C
- 1551 Unionport Rd Unit 12B
- 1551 Unionport Rd Unit 12A
- 1551 Unionport Rd Unit 11H
- 1551 Unionport Rd Unit 11G
- 1551 Unionport Rd Unit 11F
- 1551 Unionport Rd Unit 11E
- 1551 Unionport Rd Unit 11D
- 1551 Unionport Rd Unit 11C
- 1551 Unionport Rd Unit 11B
- 1551 Unionport Rd Unit 11A