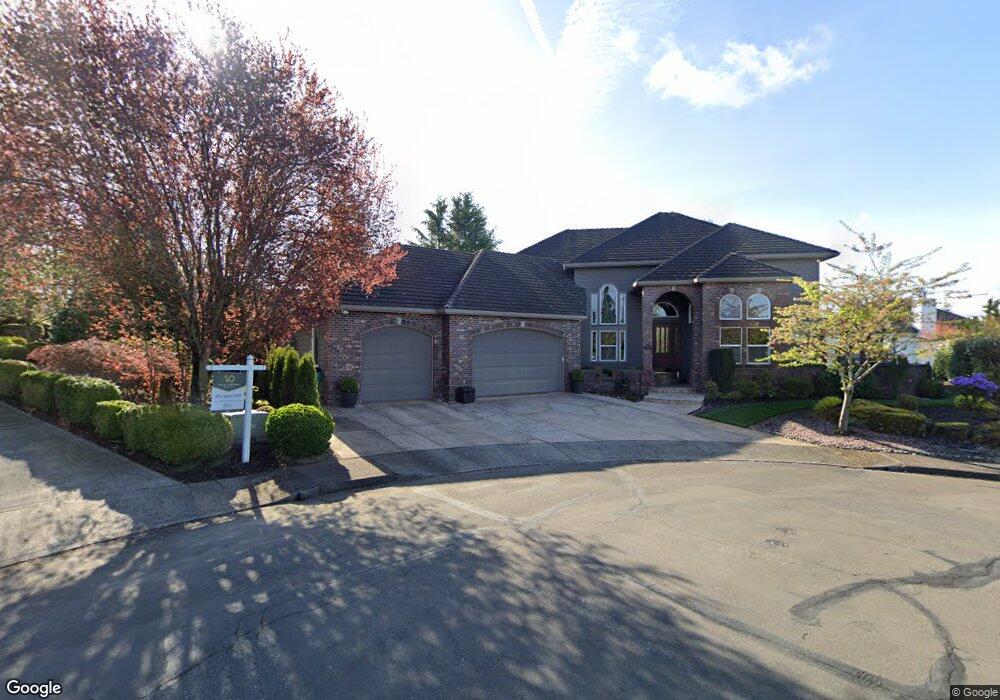
15511 SE 38th Cir Vancouver, WA 98683
Estimated Value: $1,055,000 - $1,196,302
4
Beds
3
Baths
3,263
Sq Ft
$349/Sq Ft
Est. Value
About This Home
This home is located at 15511 SE 38th Cir, Vancouver, WA 98683 and is currently estimated at $1,138,826, approximately $349 per square foot. 15511 SE 38th Cir is a home located in Clark County with nearby schools including Fishers Landing Elementary School, Shahala Middle School, and Mountain View High School.
Ownership History
Date
Name
Owned For
Owner Type
Purchase Details
Closed on
Aug 26, 2003
Sold by
Stecher Gary A and Nye Cindy L
Bought by
Stecher Gary A and Stecher Cindy L
Current Estimated Value
Home Financials for this Owner
Home Financials are based on the most recent Mortgage that was taken out on this home.
Original Mortgage
$266,750
Outstanding Balance
$118,274
Interest Rate
5.6%
Mortgage Type
Purchase Money Mortgage
Estimated Equity
$1,020,552
Purchase Details
Closed on
Mar 17, 1999
Sold by
Woellhof Heinz Katherine L
Bought by
Stecher Gary A and Nye Cindy L
Purchase Details
Closed on
Feb 3, 1997
Sold by
Pro West Inc
Bought by
Woellhof Heinz Katherine L
Purchase Details
Closed on
Oct 9, 1996
Sold by
Carter Wesley D and Carter Melonnie K
Bought by
Carter Wesley Davison and Carter Melonnie Karee
Purchase Details
Closed on
Jun 18, 1996
Sold by
Carter Wesley Davison and Carter Melonnie K
Bought by
Carter Wesley Davison and Carter Melonnie Karee
Create a Home Valuation Report for This Property
The Home Valuation Report is an in-depth analysis detailing your home's value as well as a comparison with similar homes in the area
Home Values in the Area
Average Home Value in this Area
Purchase History
| Date | Buyer | Sale Price | Title Company |
|---|---|---|---|
| Stecher Gary A | -- | Stewart Title | |
| Stecher Gary A | -- | Charter Title Corporation | |
| Woellhof Heinz Katherine L | $73,875 | First American Title Ins Co | |
| Carter Wesley Davison | -- | -- | |
| Carter Wesley Davison | -- | -- |
Source: Public Records
Mortgage History
| Date | Status | Borrower | Loan Amount |
|---|---|---|---|
| Open | Stecher Gary A | $266,750 |
Source: Public Records
Tax History Compared to Growth
Tax History
| Year | Tax Paid | Tax Assessment Tax Assessment Total Assessment is a certain percentage of the fair market value that is determined by local assessors to be the total taxable value of land and additions on the property. | Land | Improvement |
|---|---|---|---|---|
| 2025 | $9,691 | $1,059,563 | $237,120 | $822,443 |
| 2024 | $9,869 | $977,741 | $237,120 | $740,621 |
| 2023 | $9,175 | $1,033,389 | $237,120 | $796,269 |
| 2022 | $8,418 | $948,931 | $237,120 | $711,811 |
| 2021 | $8,282 | $825,689 | $200,640 | $625,049 |
| 2020 | $7,492 | $767,447 | $182,400 | $585,047 |
| 2019 | $7,214 | $700,830 | $164,820 | $536,010 |
| 2018 | $7,997 | $726,837 | $0 | $0 |
| 2017 | $7,487 | $647,561 | $0 | $0 |
| 2016 | $7,132 | $627,814 | $0 | $0 |
| 2015 | $6,888 | $572,687 | $0 | $0 |
| 2014 | -- | $528,691 | $0 | $0 |
| 2013 | -- | $465,251 | $0 | $0 |
Source: Public Records
Map
Nearby Homes
- 3911 SE 157th Ave
- 15815 SE 35th St
- 15203 SE Northshore Dr
- 15701 SE 34th Cir
- 0 SE Evergreen Hwy Unit 147631456
- 0 SE Evergreen Hwy Unit 211246418
- 4305 SE 159th Ct
- 3112 SE 156th Ave Unit 7
- 3205 SE 153rd Ave
- 3009 SE 155th Ave
- 3612 SE 165th Ave
- 16508 SE 39th St
- 15907 SE 29th St
- 16215 SE Rivershore Dr
- 3708 SE 167th Ct
- 3515 SE 144th Ct
- 2606 SE Baypoint Dr Unit 20
- 4412 SE 166th Place
- 16807 SE 35th Cir
- 16723 SE 44th Cir
- 15505 SE 38th Cir
- 15514 SE 38th Cir
- 3812 SE 157th Ave
- 3813 SE 155th Ave
- 15510 SE 38th Cir
- 15513 SE 39th Cir
- 3904 SE 157th Ave
- 3804 SE 155th Ave
- 15507 SE 39th Cir
- 3718 SE 155th Ave
- 3812 SE 155th Ave
- 15503 SE 39th Cir
- 15411 SE Rivercrest Dr
- 3809 SE 157th Ave
- 3902 SE 155th Ave
- 15512 SE 40th Cir
- 3803 SE 154th Ct
- 3908 SE 155th Ave
- 4000 SE 157th Ave
- 3807 SE 154th Ct