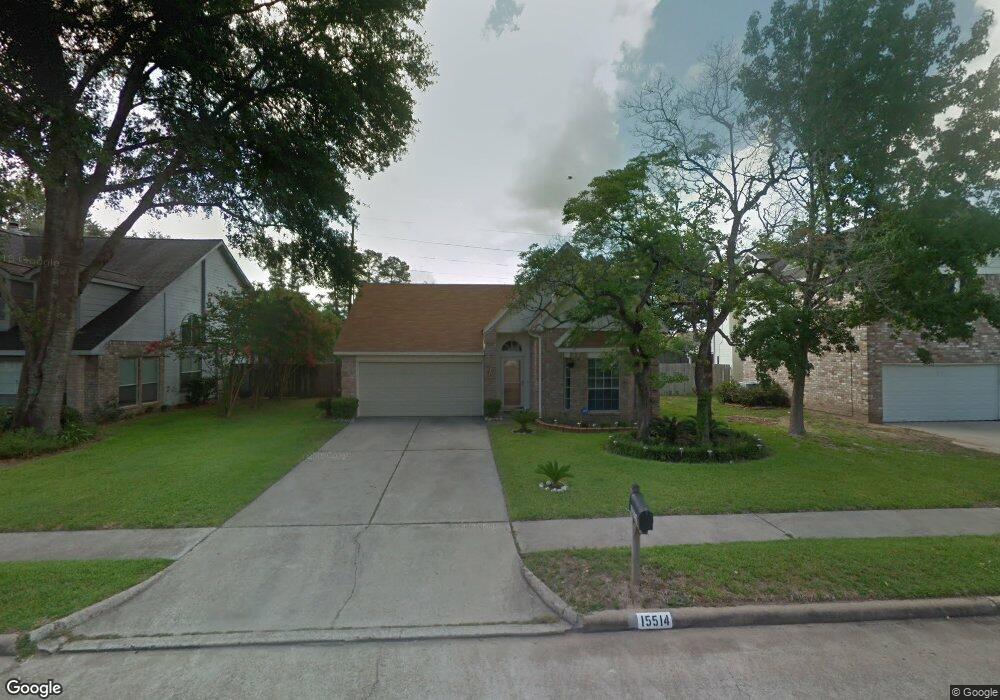
15514 Hatfield Hollow Dr Tomball, TX 77377
Estimated Value: $255,804 - $286,000
3
Beds
2
Baths
1,655
Sq Ft
$167/Sq Ft
Est. Value
About This Home
This home is located at 15514 Hatfield Hollow Dr, Tomball, TX 77377 and is currently estimated at $276,951, approximately $167 per square foot. 15514 Hatfield Hollow Dr is a home located in Harris County with nearby schools including Lakewood Elementary School, Willow Wood Junior High School, and Northpointe Intermediate School.
Ownership History
Date
Name
Owned For
Owner Type
Purchase Details
Closed on
Dec 6, 2006
Sold by
Davis Rodney A and Davis Shannon R
Bought by
Malcolm Cerese L
Current Estimated Value
Home Financials for this Owner
Home Financials are based on the most recent Mortgage that was taken out on this home.
Original Mortgage
$25,380
Outstanding Balance
$15,174
Interest Rate
6.31%
Mortgage Type
Purchase Money Mortgage
Estimated Equity
$261,777
Purchase Details
Closed on
Oct 17, 1997
Sold by
Pelton Shawn Michael and Pelton Kimberly Ann
Bought by
Davis Rodney A and Davis Shannon R
Home Financials for this Owner
Home Financials are based on the most recent Mortgage that was taken out on this home.
Original Mortgage
$82,800
Interest Rate
7.52%
Create a Home Valuation Report for This Property
The Home Valuation Report is an in-depth analysis detailing your home's value as well as a comparison with similar homes in the area
Home Values in the Area
Average Home Value in this Area
Purchase History
| Date | Buyer | Sale Price | Title Company |
|---|---|---|---|
| Malcolm Cerese L | -- | First American Title | |
| Davis Rodney A | -- | Alamo Title Company #40 |
Source: Public Records
Mortgage History
| Date | Status | Borrower | Loan Amount |
|---|---|---|---|
| Open | Malcolm Cerese L | $25,380 | |
| Open | Malcolm Cerese L | $101,520 | |
| Previous Owner | Davis Rodney A | $82,800 |
Source: Public Records
Tax History Compared to Growth
Tax History
| Year | Tax Paid | Tax Assessment Tax Assessment Total Assessment is a certain percentage of the fair market value that is determined by local assessors to be the total taxable value of land and additions on the property. | Land | Improvement |
|---|---|---|---|---|
| 2025 | $3,702 | $251,495 | $44,402 | $207,093 |
| 2024 | $3,702 | $235,339 | $44,402 | $190,937 |
| 2023 | $3,702 | $246,904 | $44,402 | $202,502 |
| 2022 | $4,591 | $218,326 | $37,001 | $181,325 |
| 2021 | $4,403 | $176,499 | $33,638 | $142,861 |
| 2020 | $4,249 | $164,111 | $31,956 | $132,155 |
| 2019 | $4,133 | $160,061 | $24,892 | $135,169 |
| 2018 | $1,559 | $141,311 | $19,173 | $122,138 |
| 2017 | $3,627 | $136,623 | $19,173 | $117,450 |
| 2016 | $3,623 | $136,623 | $19,173 | $117,450 |
| 2015 | $2,601 | $130,095 | $19,173 | $110,922 |
| 2014 | $2,601 | $116,388 | $19,173 | $97,215 |
Source: Public Records
Map
Nearby Homes
- 15614 Hatfield Hollow Dr
- 15627 Lago Villa Dr
- 15603 Canterbury Forest Dr
- 11510 Maple Falls Dr
- 11606 Gatesden Dr
- 15834 Arbor Lake Dr
- 15815 Whipple Tree Dr
- 15703 Downford Dr
- 11607 Buck Springs Trail
- 15206 Beacham Dr
- 11619 Buck Springs Trail
- 16107 Woodbend Trail Dr
- 15815 Baytree Dr
- 15603 Lakewood Terrace Dr
- 11410 Rothglen St
- 10010 Silverwood Way
- 15522 Waldwick Dr
- 15907 Timber Valley Dr
- 15418 Waldwick Dr
- 15611 Lake Iris Dr
- 15518 Hatfield Hollow Dr
- 15510 Hatfield Hollow Dr
- 15506 Hatfield Hollow Dr
- 15522 Hatfield Hollow Dr
- 15515 Hatfield Hollow Dr
- 15511 Hatfield Hollow Dr
- 15519 Hatfield Hollow Dr
- 15502 Hatfield Hollow Dr
- 15507 Hatfield Hollow Dr
- 15523 Hatfield Hollow Dr
- 15526 Hatfield Hollow Dr
- 15503 Hatfield Hollow Dr
- 11103 Middleburgh Dr
- 15602 Hatfield Hollow Dr
- 11027 Winspring Dr
- 15615 Hatfield Hollow Dr
- 11031 Winspring Dr
- 15606 Hatfield Hollow Dr
- 11102 Middleburgh Dr
- 11107 Middleburgh Dr