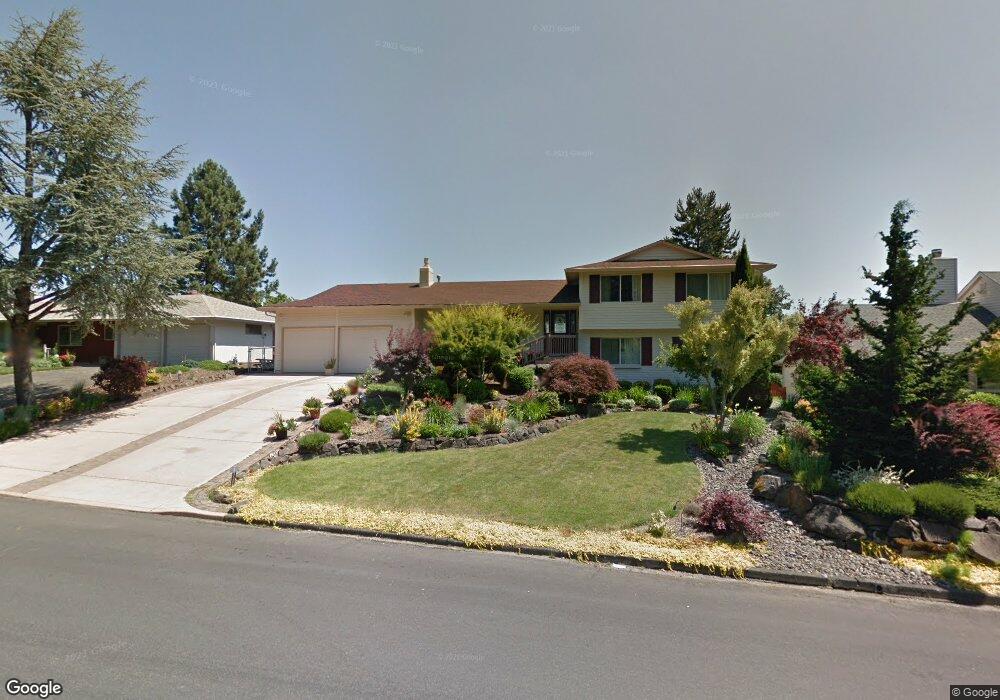
15517 NE 28th Ave Vancouver, WA 98686
Estimated Value: $642,000 - $673,000
5
Beds
3
Baths
2,474
Sq Ft
$267/Sq Ft
Est. Value
About This Home
This home is located at 15517 NE 28th Ave, Vancouver, WA 98686 and is currently estimated at $660,539, approximately $266 per square foot. 15517 NE 28th Ave is a home located in Clark County with nearby schools including Pleasant Valley Primary School, Pleasant Valley Middle School, and Prairie High School.
Ownership History
Date
Name
Owned For
Owner Type
Purchase Details
Closed on
Aug 6, 2021
Sold by
Bostick Lyla
Bought by
Mcguire Bostick Lyla
Current Estimated Value
Home Financials for this Owner
Home Financials are based on the most recent Mortgage that was taken out on this home.
Original Mortgage
$244,500
Outstanding Balance
$188,087
Interest Rate
2.9%
Mortgage Type
New Conventional
Estimated Equity
$472,452
Purchase Details
Closed on
Jul 27, 2007
Sold by
Denney William L and Denney Arlys A
Bought by
Bostick Lyla
Home Financials for this Owner
Home Financials are based on the most recent Mortgage that was taken out on this home.
Original Mortgage
$355,500
Interest Rate
6.62%
Mortgage Type
New Conventional
Purchase Details
Closed on
Jul 27, 1999
Sold by
Brown Michael R and Brown Victoria L
Bought by
Denney William L and Denney Arlys A
Home Financials for this Owner
Home Financials are based on the most recent Mortgage that was taken out on this home.
Original Mortgage
$163,400
Interest Rate
7.64%
Create a Home Valuation Report for This Property
The Home Valuation Report is an in-depth analysis detailing your home's value as well as a comparison with similar homes in the area
Home Values in the Area
Average Home Value in this Area
Purchase History
| Date | Buyer | Sale Price | Title Company |
|---|---|---|---|
| Mcguire Bostick Lyla | -- | Fidelity Natl Ttl Co Of Wa I | |
| Bostick Lyla | $395,000 | Fidelity National Title | |
| Denney William L | $172,000 | Charter Title Corporation |
Source: Public Records
Mortgage History
| Date | Status | Borrower | Loan Amount |
|---|---|---|---|
| Open | Mcguire Bostick Lyla | $244,500 | |
| Closed | Bostick Lyla | $355,500 | |
| Previous Owner | Denney William L | $163,400 |
Source: Public Records
Tax History Compared to Growth
Tax History
| Year | Tax Paid | Tax Assessment Tax Assessment Total Assessment is a certain percentage of the fair market value that is determined by local assessors to be the total taxable value of land and additions on the property. | Land | Improvement |
|---|---|---|---|---|
| 2025 | $5,103 | $604,257 | $252,450 | $351,807 |
| 2024 | $4,468 | $559,054 | $252,450 | $306,604 |
| 2023 | $4,715 | $581,864 | $244,800 | $337,064 |
| 2022 | $4,294 | $538,845 | $244,800 | $294,045 |
| 2021 | $4,161 | $432,104 | $156,750 | $275,354 |
| 2020 | $4,045 | $380,329 | $145,350 | $234,979 |
| 2019 | $3,410 | $373,383 | $150,100 | $223,283 |
| 2018 | $4,023 | $355,462 | $0 | $0 |
| 2017 | $3,527 | $320,781 | $0 | $0 |
| 2016 | $3,608 | $297,654 | $0 | $0 |
| 2015 | $3,471 | $282,446 | $0 | $0 |
| 2014 | -- | $263,038 | $0 | $0 |
| 2013 | -- | $246,155 | $0 | $0 |
Source: Public Records
Map
Nearby Homes
- 2513 NE 158th St
- 2707 NE 159th Cir
- 2519 NE 159th St
- 2722 NE 159th Cir
- 17712 NE 25th Ct Unit LOT 2
- 15711 NE 22nd Ave
- 16210 NE 27th Ave
- 2514 NE 163rd St
- 15108 NE 22nd Ave
- 14818 NE 23rd Ave
- 2012 NE 159th St
- 16922 NE 35th Ave
- 16918 NE 35th Ave
- 16914 NE 35th Ave
- 16910 NE 35th Ave
- 3300 NE 164th St Unit X1
- 3300 NE 164th St Unit S1
- 2617 NE 166th St
- 14518 NE 24th Ave
- 14605 NE 20th Ave Unit B101
- 15603 NE 28th Ave
- 15509 NE 28th Ave
- 15516 NE 29th Ave
- 15602 NE 29th Ave
- 15510 NE 29th Ave
- 15609 NE 28th Ave
- 15505 NE 28th Ave
- 15608 NE 29th Ave
- 15504 NE 29th Ave
- 15512 NE 28th Ave
- 15604 NE 28th Ave
- 2805 NE 157th St
- 15421 NE 28th Ave
- 15504 NE 28th Ave
- 15500 NE 29th Ave
- 2817 NE 157th St
- 15604 NE 30th Ave
- 2713 NE 157th St
- 2905 NE 156th St
- 15417 NE 28th Ave