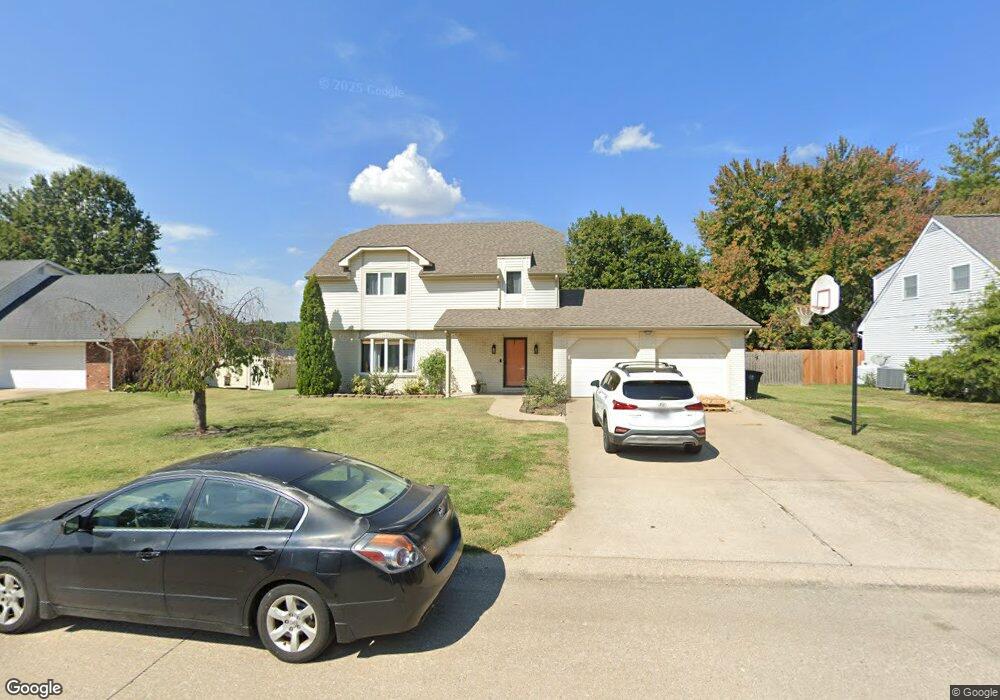
1552 Bunker Hill Cape Girardeau, MO 63701
Estimated Value: $310,480 - $328,000
4
Beds
3
Baths
1,890
Sq Ft
$169/Sq Ft
Est. Value
About This Home
This home is located at 1552 Bunker Hill, Cape Girardeau, MO 63701 and is currently estimated at $318,620, approximately $168 per square foot. 1552 Bunker Hill is a home located in Cape Girardeau County with nearby schools including Alma Schrader Elementary School, Central Middle School, and Central Junior High School.
Ownership History
Date
Name
Owned For
Owner Type
Purchase Details
Closed on
Sep 23, 2021
Sold by
Snider Justin K and Snider Whitney Jo
Bought by
Gaither Cody and Gaither Murielle
Current Estimated Value
Home Financials for this Owner
Home Financials are based on the most recent Mortgage that was taken out on this home.
Original Mortgage
$215,000
Outstanding Balance
$195,634
Interest Rate
2.8%
Mortgage Type
New Conventional
Estimated Equity
$122,986
Purchase Details
Closed on
Jul 10, 2020
Sold by
Snider Justin K and Snider Whitney J
Bought by
Snider Justin K and Snider Whitney Jo
Purchase Details
Closed on
Jun 10, 2016
Sold by
Howell Chelsea
Bought by
Snider Justin K
Purchase Details
Closed on
Sep 6, 2013
Sold by
Schneider Glenn T and Schneider Andrea R
Bought by
Snider Justin K and Snider Chelsea H
Home Financials for this Owner
Home Financials are based on the most recent Mortgage that was taken out on this home.
Original Mortgage
$185,250
Interest Rate
4.45%
Mortgage Type
New Conventional
Create a Home Valuation Report for This Property
The Home Valuation Report is an in-depth analysis detailing your home's value as well as a comparison with similar homes in the area
Home Values in the Area
Average Home Value in this Area
Purchase History
| Date | Buyer | Sale Price | Title Company |
|---|---|---|---|
| Gaither Cody | -- | None Available | |
| Snider Justin K | -- | None Available | |
| Snider Justin K | -- | -- | |
| Snider Justin K | -- | -- |
Source: Public Records
Mortgage History
| Date | Status | Borrower | Loan Amount |
|---|---|---|---|
| Open | Gaither Cody | $215,000 | |
| Previous Owner | Snider Justin K | $185,250 |
Source: Public Records
Tax History Compared to Growth
Tax History
| Year | Tax Paid | Tax Assessment Tax Assessment Total Assessment is a certain percentage of the fair market value that is determined by local assessors to be the total taxable value of land and additions on the property. | Land | Improvement |
|---|---|---|---|---|
| 2025 | $19 | $39,310 | $3,180 | $36,130 |
| 2024 | $19 | $37,440 | $3,030 | $34,410 |
| 2023 | $1,855 | $37,440 | $3,030 | $34,410 |
| 2022 | $1,710 | $34,500 | $2,790 | $31,710 |
| 2021 | $1,710 | $34,500 | $2,790 | $31,710 |
| 2020 | $1,715 | $34,500 | $2,790 | $31,710 |
| 2019 | $1,713 | $34,500 | $0 | $0 |
| 2018 | $1,710 | $34,500 | $0 | $0 |
| 2017 | $1,714 | $34,500 | $0 | $0 |
| 2016 | $1,602 | $32,390 | $0 | $0 |
| 2015 | $1,604 | $32,390 | $0 | $0 |
| 2014 | $1,613 | $32,390 | $0 | $0 |
Source: Public Records
Map
Nearby Homes
- 1413 Parkmor Dr
- 1572 Lexington Ave
- 1553 Valley Forge Ln
- 1577 Saratoga St
- 1910 Sherwood Dr
- 1608 Lexington Ave
- 1230 Brookshire Rd Unit 1230 & 1232
- 1623 Lexington Ave
- 2062 Concord Place
- 2213 Crown Point Dr
- 0 W Cape Rock Drive (Lot# 2) Unit MIS25044464
- 1960 Briarwood Dr
- 1912 Perryville Rd
- 11 Dumaine St
- 7 Turtle Ln
- 1533 Birchwood
- 1546 Oak Lei Dr
- 1938 Westwood Dr
- 2237 Sherwood Dr
- 12 Terrapin Rd
- 1552 Bunker Hill Dr
- 1548 Bunker Hill
- 1556 Bunker Hill
- 1549 Saratoga St
- 1553 Saratoga St
- 1545 Saratoga St
- 1551 Bunker Hill
- 1544 Bunker Hill Dr
- 1555 Bunker Hill Dr
- 1560 Bunker Hill Dr
- 1555 Bunker Hill
- 1547 Bunker Hill
- 0 Bunker Hill Unit 58493
- 1541 Saratoga St
- 1557 Saratoga St
- 1559 Bunker Hill
- 1543 Bunker Hill
- 1564 Bunker Hill
- 1550 Saratoga St
- 1563 Bunker Hill Dr