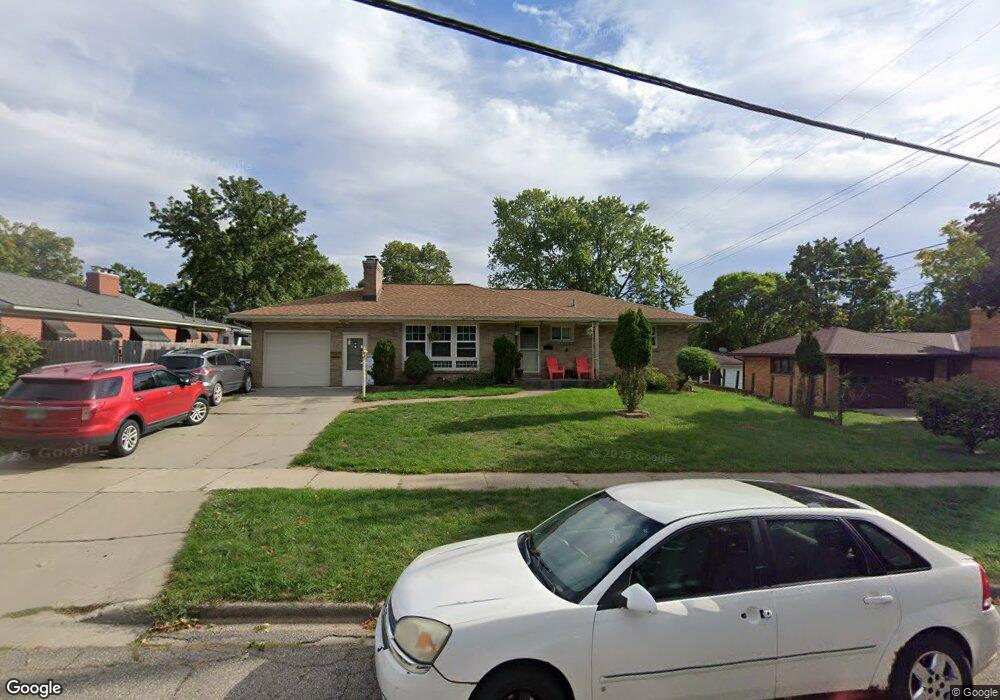
1552 Sweet St NE Grand Rapids, MI 49505
North East Citizens Action NeighborhoodEstimated Value: $311,000 - $351,000
3
Beds
2
Baths
1,520
Sq Ft
$213/Sq Ft
Est. Value
About This Home
This home is located at 1552 Sweet St NE, Grand Rapids, MI 49505 and is currently estimated at $323,787, approximately $213 per square foot. 1552 Sweet St NE is a home located in Kent County with nearby schools including Kent Hills School, Riverside Middle School, and Union High School.
Ownership History
Date
Name
Owned For
Owner Type
Purchase Details
Closed on
Mar 21, 2005
Sold by
Roggow Ryan J and Roggow Rebecca
Bought by
Sharpe Lloyd
Current Estimated Value
Home Financials for this Owner
Home Financials are based on the most recent Mortgage that was taken out on this home.
Original Mortgage
$134,883
Outstanding Balance
$68,518
Interest Rate
5.64%
Mortgage Type
FHA
Estimated Equity
$255,269
Purchase Details
Closed on
Sep 27, 2002
Sold by
Roggow Ryan J and Roggow Rebecca
Bought by
Roggow Ryan J and Roggow Rebecca
Home Financials for this Owner
Home Financials are based on the most recent Mortgage that was taken out on this home.
Original Mortgage
$69,000
Interest Rate
6.39%
Mortgage Type
Purchase Money Mortgage
Purchase Details
Closed on
Jun 10, 1998
Sold by
Roggow Roggow R R and Roggow L
Bought by
Sharpe Roggow R and Sharpe Lloyd
Purchase Details
Closed on
May 14, 1998
Sold by
Vndyk Est and Vndyk Roggow R
Bought by
Roggow Roggow R and Roggow L
Create a Home Valuation Report for This Property
The Home Valuation Report is an in-depth analysis detailing your home's value as well as a comparison with similar homes in the area
Home Values in the Area
Average Home Value in this Area
Purchase History
| Date | Buyer | Sale Price | Title Company |
|---|---|---|---|
| Sharpe Lloyd | $137,000 | Metropolitan Title Company | |
| Roggow Ryan J | -- | -- | |
| Sharpe Roggow R | $84,000 | -- | |
| Roggow Roggow R | -- | -- |
Source: Public Records
Mortgage History
| Date | Status | Borrower | Loan Amount |
|---|---|---|---|
| Open | Sharpe Lloyd | $134,883 | |
| Previous Owner | Roggow Ryan J | $69,000 |
Source: Public Records
Tax History Compared to Growth
Tax History
| Year | Tax Paid | Tax Assessment Tax Assessment Total Assessment is a certain percentage of the fair market value that is determined by local assessors to be the total taxable value of land and additions on the property. | Land | Improvement |
|---|---|---|---|---|
| 2025 | $2,437 | $146,900 | $0 | $0 |
| 2024 | $2,437 | $136,200 | $0 | $0 |
| 2023 | $2,472 | $117,700 | $0 | $0 |
| 2022 | $2,347 | $101,600 | $0 | $0 |
| 2021 | $2,295 | $95,500 | $0 | $0 |
| 2020 | $2,194 | $89,600 | $0 | $0 |
| 2019 | $2,219 | $80,300 | $0 | $0 |
| 2018 | $2,219 | $77,500 | $0 | $0 |
| 2017 | $2,160 | $73,100 | $0 | $0 |
| 2016 | $2,186 | $65,100 | $0 | $0 |
| 2015 | $2,034 | $65,100 | $0 | $0 |
| 2013 | -- | $62,400 | $0 | $0 |
Source: Public Records
Map
Nearby Homes
- 1524 Sweet St NE
- 1518 Mayfield Ave NE
- 1455 Ball Ave NE
- 1444 Sweet St NE
- 1452 Carlton Ave NE
- 1250 Mayfield Ave NE
- 1237 Dale Ct NE
- 1238 Carlton Ave NE
- 1119 Spencer St NE
- 1339 Fuller Ave NE
- 1119 Kentwood Dr NE
- 1332 Leonard St NE
- 1824 Herrick Ave NE
- 1335 Knapp St NE
- 2027 Joan Ave NE
- 1420 Worcester Dr NE
- 2016 Tall Meadow St NE
- 2151 Chelsea Rd NE
- 2100 Dawson Ave NE
- 1228 Spring Ave NE
- 1559 Ball Ave NE
- 1542 Sweet St NE
- 1545 Ball Ave NE
- 1554 Edith Ave NE
- 1546 Edith Ave NE
- 1539 Ball Ave NE
- 1611 Ball Ave NE
- 1541 Sweet St NE
- 1540 Edith Ave NE
- 1531 Ball Ave NE
- 1560 Ball Ave NE
- 1552 Ball Ave NE
- 1623 Ball Ave NE
- 1618 Edith Ave NE
- 1532 Edith Ave NE
- 1530 Ball Ave NE
- 1525 Ball Ave NE
- 1555 Edith Ave NE
- 1528 Ball Ave NE
- 1626 Edith Ave NE