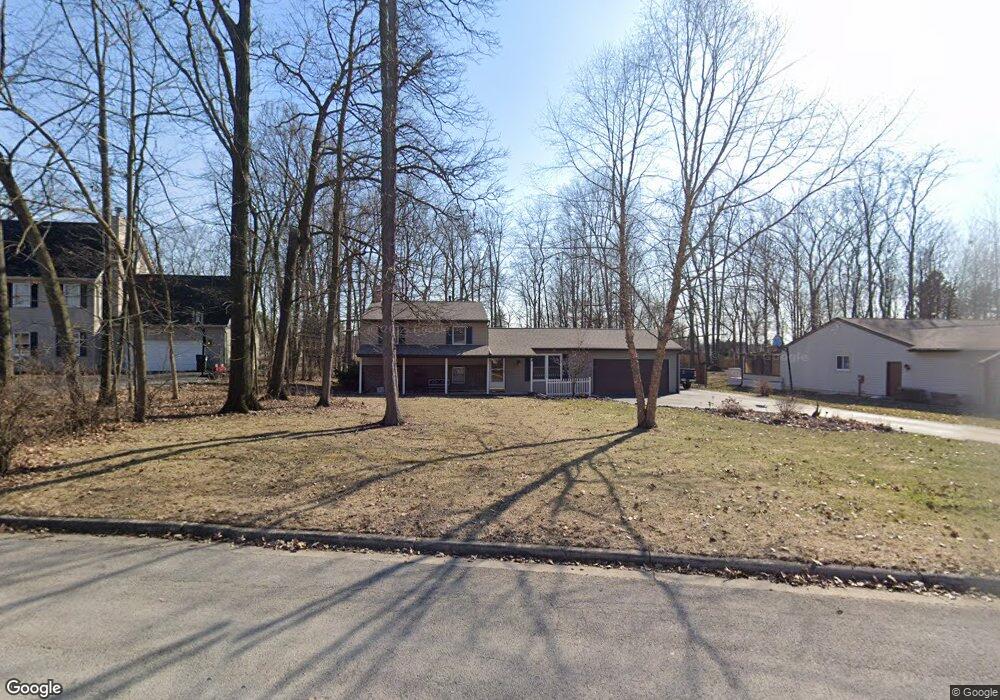
15521 Thornwood Dr Findlay, OH 45840
Estimated Value: $282,788 - $364,000
3
Beds
2
Baths
1,744
Sq Ft
$182/Sq Ft
Est. Value
About This Home
This home is located at 15521 Thornwood Dr, Findlay, OH 45840 and is currently estimated at $317,947, approximately $182 per square foot. 15521 Thornwood Dr is a home located in Hancock County with nearby schools including Van Buren Elementary School, Van Buren Middle School, and Van Buren High School.
Ownership History
Date
Name
Owned For
Owner Type
Purchase Details
Closed on
Jul 17, 2002
Sold by
Collins Thomas E
Bought by
Gearhart William T and Bonham Deborah A
Current Estimated Value
Home Financials for this Owner
Home Financials are based on the most recent Mortgage that was taken out on this home.
Original Mortgage
$137,000
Outstanding Balance
$58,406
Interest Rate
6.79%
Mortgage Type
New Conventional
Estimated Equity
$259,541
Purchase Details
Closed on
Sep 26, 1995
Sold by
Harrschuh Wayne
Bought by
Collins Thomas and Collins Sharon
Home Financials for this Owner
Home Financials are based on the most recent Mortgage that was taken out on this home.
Original Mortgage
$116,850
Interest Rate
7.13%
Mortgage Type
New Conventional
Purchase Details
Closed on
Aug 21, 1987
Bought by
Hunley Michael G and Hunley Julie E
Create a Home Valuation Report for This Property
The Home Valuation Report is an in-depth analysis detailing your home's value as well as a comparison with similar homes in the area
Home Values in the Area
Average Home Value in this Area
Purchase History
| Date | Buyer | Sale Price | Title Company |
|---|---|---|---|
| Gearhart William T | $154,000 | -- | |
| Collins Thomas | $123,000 | -- | |
| Hunley Michael G | $87,000 | -- |
Source: Public Records
Mortgage History
| Date | Status | Borrower | Loan Amount |
|---|---|---|---|
| Open | Gearhart William T | $137,000 | |
| Previous Owner | Collins Thomas | $116,850 |
Source: Public Records
Tax History Compared to Growth
Tax History
| Year | Tax Paid | Tax Assessment Tax Assessment Total Assessment is a certain percentage of the fair market value that is determined by local assessors to be the total taxable value of land and additions on the property. | Land | Improvement |
|---|---|---|---|---|
| 2024 | $2,436 | $77,690 | $16,660 | $61,030 |
| 2023 | $2,424 | $77,690 | $16,660 | $61,030 |
| 2022 | $2,424 | $77,690 | $16,660 | $61,030 |
| 2021 | $2,160 | $65,120 | $16,630 | $48,490 |
| 2020 | $2,158 | $65,120 | $16,630 | $48,490 |
| 2019 | $2,233 | $65,120 | $16,630 | $48,490 |
| 2018 | $1,972 | $56,620 | $14,460 | $42,160 |
| 2017 | $1,978 | $56,620 | $14,460 | $42,160 |
| 2016 | $1,927 | $56,620 | $14,460 | $42,160 |
| 2015 | $1,723 | $49,750 | $14,040 | $35,710 |
| 2014 | $1,685 | $49,900 | $14,040 | $35,860 |
| 2012 | $1,854 | $50,450 | $14,040 | $36,410 |
Source: Public Records
Map
Nearby Homes
- 7137 Township Road 212
- 15680 Thornwood Dr
- 15711 Mahogany Trail
- 7507 Township Road 212
- 0 E Us Route 224
- 7633 Brookstone Dr
- 7665 Brookstone Dr
- 15329 E Us Route 224
- 7752 E Point Dr
- 0 Hickory Ln Unit 1 307878
- 0 Hickory Ln Unit 20252999
- 0 Hickory Ln Unit 6133896
- 0 Forest Ln Unit 6136549
- 8100 Shawnee Forest Dr
- 16078 Forest Lake Dr
- 2024 Silverstone Dr
- 0 Meadowview Dr
- 665 Meadowview Dr
- 6339 Township Road 243
- 0 Lakeside Dr
- 15546 Thornwood Dr
- 15597 Thornwood Dr
- 15617 Thornwood Dr
- 7071 Township Road 212
- 15590 Thornwood Dr
- 7057 Township Road 212
- 15633 Thornwood Dr
- 7117 Township Road 212
- 15576 Thornwood Dr
- 15550 Thornwood Dr
- 15606 Thornwood Dr
- 7027 Township Road 212
- 15647 Thornwood Dr
- 15636 Thornwood Dr
- 7007 Township Road 212
- 7159 Township Road 212
- 0 Township Road 212
- 7183 Township Road 212
- 7183 Township Rd
- 15683 Thornwood Dr