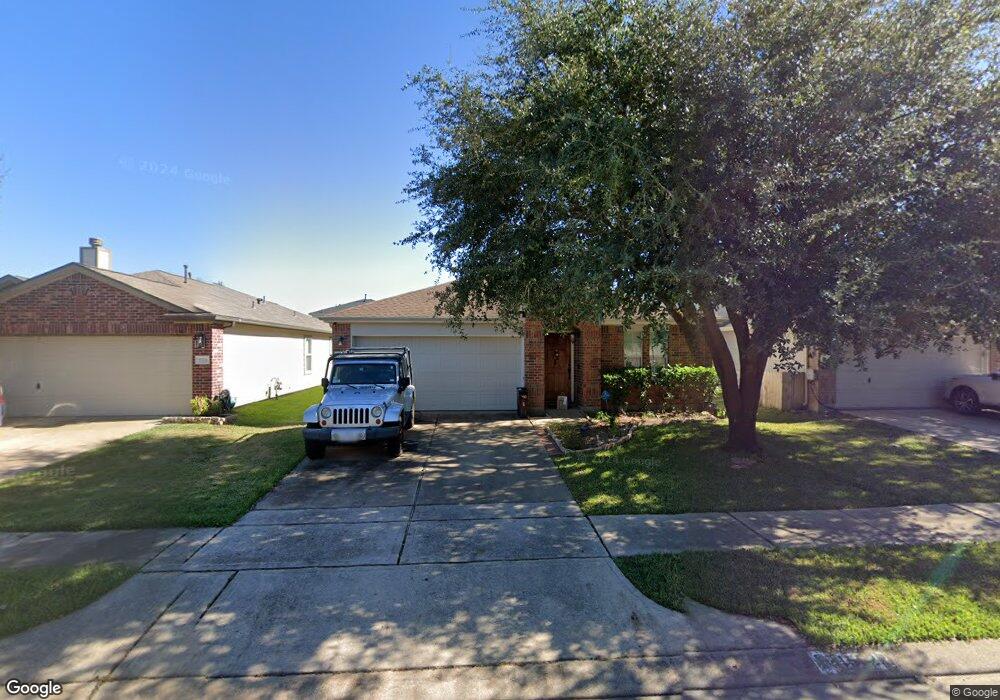
15522 Field Yucca Ln Cypress, TX 77429
Estimated Value: $280,758 - $319,000
3
Beds
2
Baths
1,922
Sq Ft
$155/Sq Ft
Est. Value
About This Home
This home is located at 15522 Field Yucca Ln, Cypress, TX 77429 and is currently estimated at $297,440, approximately $154 per square foot. 15522 Field Yucca Ln is a home located in Harris County with nearby schools including Farney Elementary School, Goodson Middle, and Cypress Woods High School.
Ownership History
Date
Name
Owned For
Owner Type
Purchase Details
Closed on
May 25, 2012
Sold by
Secretary Of Hud
Bought by
Hopper Melissa N
Current Estimated Value
Home Financials for this Owner
Home Financials are based on the most recent Mortgage that was taken out on this home.
Original Mortgage
$101,648
Outstanding Balance
$70,427
Interest Rate
3.9%
Mortgage Type
FHA
Estimated Equity
$227,013
Purchase Details
Closed on
Oct 11, 2010
Sold by
Morse Dane W and Laird Megan R
Bought by
Bac Home Loans Servicing Lp and Countrywide Home Loans Servicing Lp
Purchase Details
Closed on
Oct 7, 2010
Sold by
Bac Home Loans Servicing Lp
Bought by
Secretary Of Hud
Purchase Details
Closed on
Nov 26, 2008
Sold by
Kb Home Lone Star Inc
Bought by
Morse Dane W and Laird Megan R
Home Financials for this Owner
Home Financials are based on the most recent Mortgage that was taken out on this home.
Original Mortgage
$117,358
Interest Rate
6.19%
Mortgage Type
FHA
Create a Home Valuation Report for This Property
The Home Valuation Report is an in-depth analysis detailing your home's value as well as a comparison with similar homes in the area
Home Values in the Area
Average Home Value in this Area
Purchase History
| Date | Buyer | Sale Price | Title Company |
|---|---|---|---|
| Hopper Melissa N | -- | None Available | |
| Bac Home Loans Servicing Lp | $125,052 | None Available | |
| Secretary Of Hud | -- | None Available | |
| Morse Dane W | -- | Etc |
Source: Public Records
Mortgage History
| Date | Status | Borrower | Loan Amount |
|---|---|---|---|
| Open | Hopper Melissa N | $101,648 | |
| Previous Owner | Morse Dane W | $117,358 |
Source: Public Records
Tax History Compared to Growth
Tax History
| Year | Tax Paid | Tax Assessment Tax Assessment Total Assessment is a certain percentage of the fair market value that is determined by local assessors to be the total taxable value of land and additions on the property. | Land | Improvement |
|---|---|---|---|---|
| 2025 | $4,778 | $290,402 | $58,995 | $231,407 |
| 2024 | $4,778 | $277,941 | $58,995 | $218,946 |
| 2023 | $4,778 | $302,322 | $58,995 | $243,327 |
| 2022 | $6,259 | $259,032 | $43,729 | $215,303 |
| 2021 | $6,022 | $204,822 | $43,729 | $161,093 |
| 2020 | $5,700 | $187,247 | $33,638 | $153,609 |
| 2019 | $5,758 | $181,331 | $27,169 | $154,162 |
| 2018 | $1,595 | $169,734 | $27,169 | $142,565 |
| 2017 | $5,578 | $169,734 | $27,169 | $142,565 |
| 2016 | $5,278 | $160,601 | $27,169 | $133,432 |
| 2015 | $3,135 | $157,448 | $27,169 | $130,279 |
| 2014 | $3,135 | $136,124 | $27,169 | $108,955 |
Source: Public Records
Map
Nearby Homes
- 16218 Range Valley Ln
- 16350 Melody View Ct
- 16202 Peach Bluff Ln
- 16110 Peach Bluff Ln
- 15211 Sunlight Bay Ct
- 16906 Shoal Park Dr
- 15603 Bluff Park Ct
- 15706 Whispering Green Dr
- 16106 Ladino Run St
- 17010 Cypress Knee Dr
- 16107 Dusty Path Ln
- 15826 Stable Creek Cir
- 16019 Rustlers Trail Ln
- 16515 Nightingale Falls Ct
- 16503 Timberidge Ct
- 14806 Cypress Timber Dr
- 16551 Cypress Bridge Dr
- 15418 Stable Star Cir
- 15331 Springhill Bend Ln
- 17214 Huffmeister Rd
- 15526 Field Yucca Ln
- 15518 Field Yucca Ln
- 15514 Field Yucca Ln
- 15530 Field Yucca Ln
- 15327 Boulder Hollow Ln
- 15331 Boulder Hollow Ln
- 15323 Boulder Hollow Ln
- 15335 Boulder Hollow Ln
- 15510 Field Yucca Ln
- 15523 Field Yucca Ln
- 15519 Field Yucca Ln
- 15527 Field Yucca Ln
- 15515 Field Yucca Ln
- 15319 Boulder Hollow Ln
- 15531 Field Yucca Ln
- 15315 Boulder Hollow Ln
- 15511 Field Yucca Ln
- 15311 Boulder Hollow Ln
- 16314 Rustic Stable Ln
- 15535 Field Yucca Ln