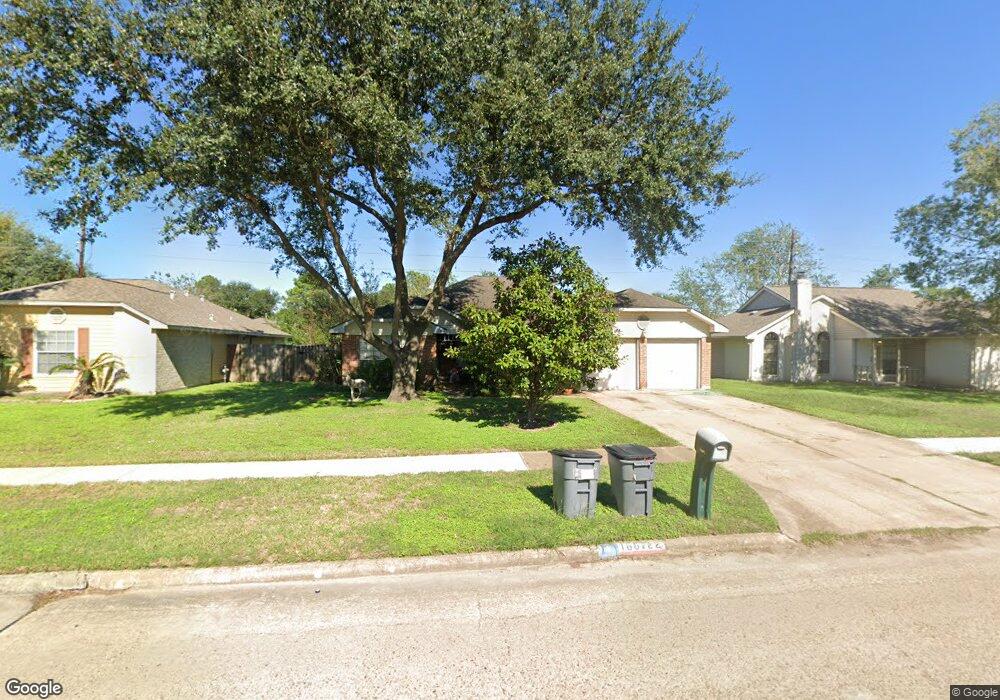
15522 Pebble Lake Dr Houston, TX 77095
Estimated Value: $260,075 - $281,000
3
Beds
2
Baths
1,930
Sq Ft
$142/Sq Ft
Est. Value
About This Home
This home is located at 15522 Pebble Lake Dr, Houston, TX 77095 and is currently estimated at $274,019, approximately $141 per square foot. 15522 Pebble Lake Dr is a home located in Harris County with nearby schools including Fiest Elementary School, Labay Middle School, and Cypress Falls High School.
Ownership History
Date
Name
Owned For
Owner Type
Purchase Details
Closed on
Jul 29, 2021
Sold by
Bader Robert and Bader Gayle
Bought by
1999 Bader Trust and Bader
Current Estimated Value
Purchase Details
Closed on
Jun 23, 2008
Sold by
Ferguson Theodore and Ferguson Pamela F
Bought by
Bader 1999 Trust
Purchase Details
Closed on
May 21, 2008
Sold by
Ferguson Theodore and Ferguson Pamela F
Bought by
Bader Gayle and Bader Robert
Purchase Details
Closed on
Aug 28, 1998
Sold by
Lambert Thomas M and Lambert Linda C
Bought by
Ferguson Theodore and Ferguson Pamela F
Home Financials for this Owner
Home Financials are based on the most recent Mortgage that was taken out on this home.
Original Mortgage
$88,272
Interest Rate
6.94%
Mortgage Type
FHA
Create a Home Valuation Report for This Property
The Home Valuation Report is an in-depth analysis detailing your home's value as well as a comparison with similar homes in the area
Home Values in the Area
Average Home Value in this Area
Purchase History
| Date | Buyer | Sale Price | Title Company |
|---|---|---|---|
| 1999 Bader Trust | -- | None Listed On Document | |
| Bader 1999 Trust | -- | Startex Title Company | |
| Bader Gayle | -- | Startex Title Company | |
| Ferguson Theodore | -- | Chicago Title |
Source: Public Records
Mortgage History
| Date | Status | Borrower | Loan Amount |
|---|---|---|---|
| Previous Owner | Ferguson Theodore | $88,272 |
Source: Public Records
Tax History Compared to Growth
Tax History
| Year | Tax Paid | Tax Assessment Tax Assessment Total Assessment is a certain percentage of the fair market value that is determined by local assessors to be the total taxable value of land and additions on the property. | Land | Improvement |
|---|---|---|---|---|
| 2025 | $5,775 | $245,937 | $55,939 | $189,998 |
| 2024 | $5,775 | $252,574 | $55,939 | $196,635 |
| 2023 | $5,775 | $263,958 | $55,939 | $208,019 |
| 2022 | $5,836 | $235,400 | $50,974 | $184,426 |
| 2021 | $4,830 | $184,570 | $50,974 | $133,596 |
| 2020 | $4,768 | $176,130 | $42,368 | $133,762 |
| 2019 | $4,439 | $159,219 | $27,473 | $131,746 |
| 2018 | $2,331 | $161,888 | $27,473 | $134,415 |
| 2017 | $4,515 | $161,888 | $27,473 | $134,415 |
| 2016 | $4,515 | $161,888 | $27,473 | $134,415 |
| 2015 | $1,776 | $145,368 | $27,473 | $117,895 |
| 2014 | $1,776 | $128,049 | $22,839 | $105,210 |
Source: Public Records
Map
Nearby Homes
- 15634 Haleys Landing Ln
- 15610 Tarpon Springs Ct
- 15610 Manorford Ct
- 8526 Greenleaf Lake Dr
- 15627 Kentwater Ct
- 15414 Swan Creek Dr
- 15611 Meadow Village Dr
- 15415 Swan Creek Dr
- 15735 Jamie Lee Dr
- 15362 Meadow Village Dr
- 9303 Reston Grove Ln
- 15802 Aberdeen Trails Dr
- 9111 Baber Dr
- 9119 Baber Dr
- 15339 Glenwood Park Dr
- 15314 Tysor Park Ln
- 9111 Sunny Ridge Dr
- 8818 Apple Mill Dr
- 9303 Rush Mill Ct
- 9307 Rush Mill Ct
- 15526 Pebble Lake Dr
- 15518 Pebble Lake Dr
- 15627 Barber Grove Ln
- 15623 Barber Grove Ln
- 15619 Barber Grove Ln
- 15631 Barber Grove Ln
- 15514 Pebble Lake Dr
- 15530 Pebble Lake Dr
- 15635 Barber Grove Ln
- 15615 Barber Grove Ln
- 8534 Rose Manor Dr
- 15639 Barber Grove Ln
- 15611 Barber Grove Ln
- 15519 Pebble Lake Dr
- 15510 Pebble Lake Dr
- 15602 Pebble Lake Dr
- 8530 Rose Manor Dr
- 15643 Barber Grove Ln
- 15607 Barber Grove Ln
- 15515 Pebble Lake Dr