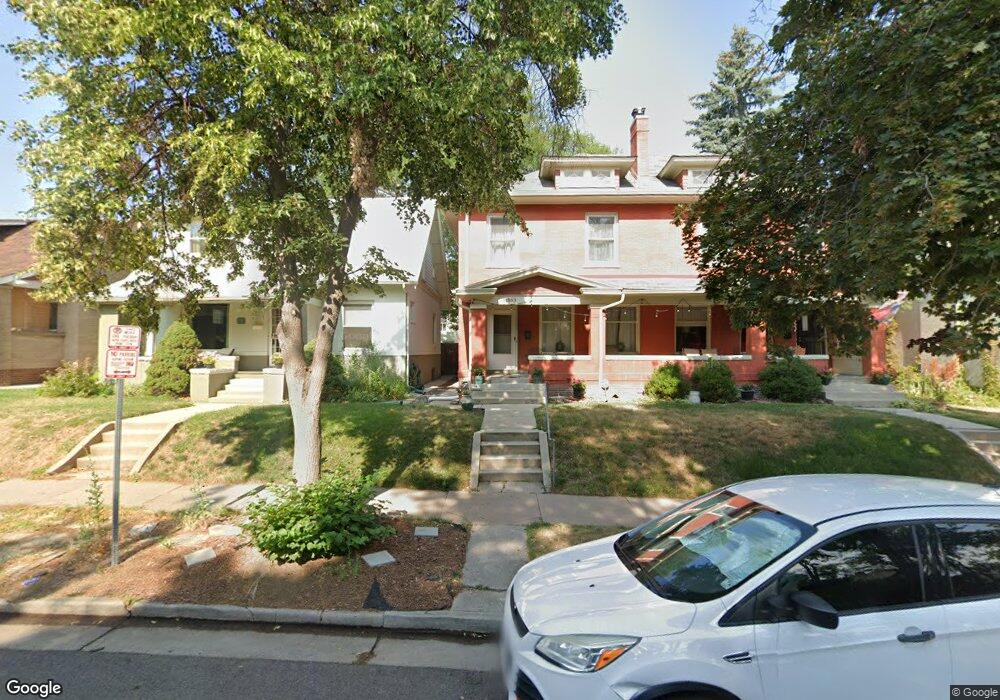
1553 Adams St Denver, CO 80206
City Park NeighborhoodEstimated Value: $660,000 - $834,000
3
Beds
1
Bath
2,030
Sq Ft
$362/Sq Ft
Est. Value
About This Home
This home is located at 1553 Adams St, Denver, CO 80206 and is currently estimated at $735,796, approximately $362 per square foot. 1553 Adams St is a home located in Denver County with nearby schools including Teller Elementary School, Morey Middle School, and East High School.
Ownership History
Date
Name
Owned For
Owner Type
Purchase Details
Closed on
Jun 15, 2009
Sold by
Hauptman Patrice M
Bought by
Yunt Christopher D and Yunt Zulma X
Current Estimated Value
Home Financials for this Owner
Home Financials are based on the most recent Mortgage that was taken out on this home.
Original Mortgage
$294,566
Outstanding Balance
$183,496
Interest Rate
4.83%
Mortgage Type
FHA
Estimated Equity
$552,300
Purchase Details
Closed on
Jun 1, 2000
Sold by
Buff Christopher Ann
Bought by
Hauptman Patrice M
Home Financials for this Owner
Home Financials are based on the most recent Mortgage that was taken out on this home.
Original Mortgage
$123,000
Interest Rate
8.17%
Create a Home Valuation Report for This Property
The Home Valuation Report is an in-depth analysis detailing your home's value as well as a comparison with similar homes in the area
Home Values in the Area
Average Home Value in this Area
Purchase History
| Date | Buyer | Sale Price | Title Company |
|---|---|---|---|
| Yunt Christopher D | $300,000 | Title America | |
| Hauptman Patrice M | $223,000 | First American |
Source: Public Records
Mortgage History
| Date | Status | Borrower | Loan Amount |
|---|---|---|---|
| Open | Yunt Christopher D | $294,566 | |
| Previous Owner | Hauptman Patrice M | $123,000 |
Source: Public Records
Tax History
| Year | Tax Paid | Tax Assessment Tax Assessment Total Assessment is a certain percentage of the fair market value that is determined by local assessors to be the total taxable value of land and additions on the property. | Land | Improvement |
|---|---|---|---|---|
| 2025 | $3,335 | $45,890 | $19,470 | $19,470 |
| 2024 | $3,335 | $42,110 | $14,820 | $27,290 |
| 2023 | $3,263 | $42,110 | $14,820 | $27,290 |
| 2022 | $3,110 | $39,110 | $18,130 | $20,980 |
| 2021 | $3,003 | $40,240 | $18,650 | $21,590 |
| 2020 | $2,592 | $34,930 | $15,360 | $19,570 |
| 2019 | $2,519 | $34,930 | $15,360 | $19,570 |
| 2018 | $2,640 | $34,130 | $10,500 | $23,630 |
| 2017 | $2,633 | $34,130 | $10,500 | $23,630 |
| 2016 | $2,645 | $32,430 | $11,606 | $20,824 |
| 2015 | $2,534 | $32,430 | $11,606 | $20,824 |
| 2014 | $2,092 | $25,190 | $5,787 | $19,403 |
Source: Public Records
Map
Nearby Homes
- 1532 Steele St
- 1620 Steele St
- 1489 Steele St Unit 122
- 1489 Steele St Unit 104
- 1489 Steele St Unit 201
- 1611 Steele St
- 1516 Cook St
- 1643 Adams St
- 1435 Adams St
- 1605 Saint Paul St Unit 10
- 3021 E 16th Ave
- 1560 Milwaukee St Unit 240
- 1623 Saint Paul St Unit 405
- 1623 Saint Paul St Unit 310
- 3000 E 16th Ave Unit 110
- 1415 Steele St Unit 401
- 1488 Madison St Unit 102
- 1488 Madison St Unit 307
- 1488 Madison St Unit 501
- 1380 Adams St Unit D
Your Personal Tour Guide
Ask me questions while you tour the home.