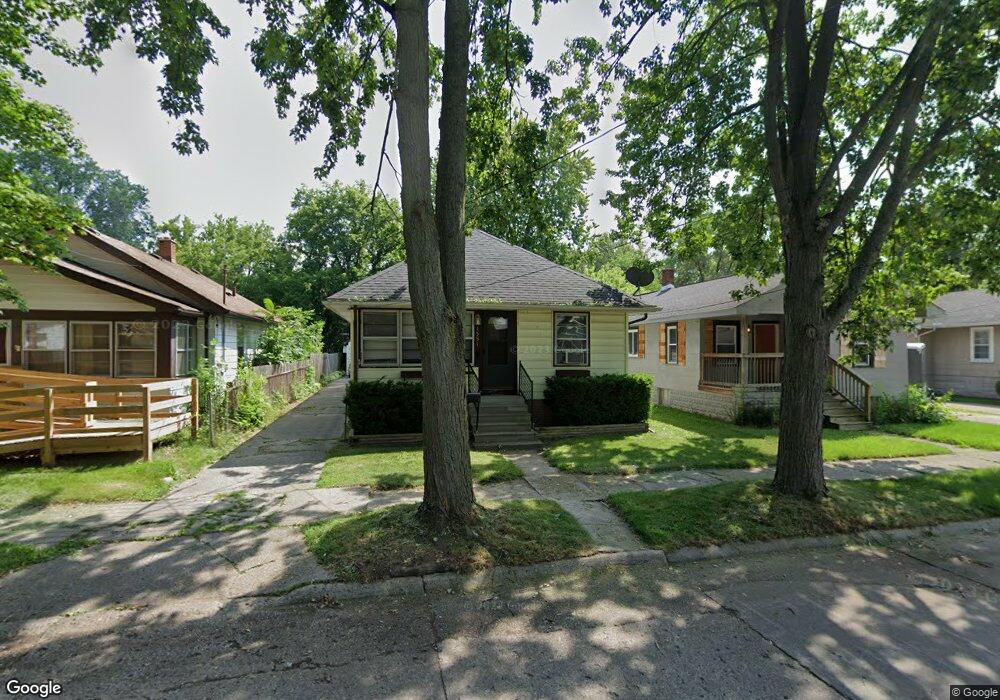
1553 Beech St Saginaw, MI 48602
Estimated Value: $64,729 - $84,000
2
Beds
1
Bath
756
Sq Ft
$98/Sq Ft
Est. Value
About This Home
This home is located at 1553 Beech St, Saginaw, MI 48602 and is currently estimated at $73,932, approximately $97 per square foot. 1553 Beech St is a home located in Saginaw County with nearby schools including Chester F. Miller School, Thompson Middle School, and Arthur Hill High School.
Ownership History
Date
Name
Owned For
Owner Type
Purchase Details
Closed on
Apr 20, 2011
Sold by
Kerr Misty
Bought by
Hudson Equities Llc
Current Estimated Value
Purchase Details
Closed on
Feb 15, 2011
Sold by
Shinners Jacob
Bought by
Kerr Misty
Purchase Details
Closed on
Dec 23, 2008
Sold by
Shiners Jacob and Shiners Tracy
Bought by
Affordalbe Housing Sales & Leasing
Purchase Details
Closed on
Oct 8, 2008
Sold by
Us Bank National Assoc
Bought by
Shinners Jacob
Purchase Details
Closed on
Sep 28, 2007
Sold by
Owensby Greg
Bought by
Chase Bank Usa
Purchase Details
Closed on
Aug 21, 1998
Sold by
Maul Robert F and Maul Arlene C
Bought by
Owensby Greg
Purchase Details
Closed on
Sep 1, 1996
Purchase Details
Closed on
Sep 22, 1986
Sold by
Gwd Rentals
Bought by
Maul Robert F and Maul Patricia L
Purchase Details
Closed on
Aug 7, 1981
Sold by
Edwards Eugene L and Edwards Janice J
Bought by
Gwd Rentals
Purchase Details
Closed on
Aug 12, 1980
Sold by
Lewis Gary H and Lewis Jacquelin K
Bought by
Edwards Eugene L and Edwards Janice J
Create a Home Valuation Report for This Property
The Home Valuation Report is an in-depth analysis detailing your home's value as well as a comparison with similar homes in the area
Home Values in the Area
Average Home Value in this Area
Purchase History
| Date | Buyer | Sale Price | Title Company |
|---|---|---|---|
| Hudson Equities Llc | -- | -- | |
| Kerr Misty | -- | -- | |
| Affordalbe Housing Sales & Leasing | -- | -- | |
| Shinners Jacob | $8,000 | -- | |
| Us Bank Na | -- | -- | |
| Chase Bank Usa | $51,000 | -- | |
| Owensby Greg | $42,000 | -- | |
| -- | $42,000 | -- | |
| Maul Robert F | -- | -- | |
| Gwd Rentals | $37,900 | -- | |
| Edwards Eugene L | $34,900 | -- |
Source: Public Records
Tax History Compared to Growth
Tax History
| Year | Tax Paid | Tax Assessment Tax Assessment Total Assessment is a certain percentage of the fair market value that is determined by local assessors to be the total taxable value of land and additions on the property. | Land | Improvement |
|---|---|---|---|---|
| 2025 | $1,523 | $25,400 | $0 | $0 |
| 2024 | $1,293 | $23,600 | $0 | $0 |
| 2023 | $1,252 | $21,600 | $0 | $0 |
| 2022 | $1,155 | $18,000 | $0 | $0 |
| 2021 | $1,328 | $15,600 | $0 | $0 |
| 2020 | $1,210 | $15,000 | $0 | $0 |
| 2019 | $1,203 | $14,300 | $900 | $13,400 |
| 2018 | $1,339 | $14,467 | $0 | $0 |
| 2017 | $1,378 | $14,300 | $0 | $0 |
| 2016 | $1,241 | $14,387 | $0 | $0 |
| 2014 | -- | $14,597 | $0 | $13,667 |
| 2013 | -- | $14,640 | $0 | $0 |
Source: Public Records
Map
Nearby Homes
- 643 Thurman St
- 1515 Beech St
- 807 Thurman St
- 714 Yale St
- 311 Brockway Place
- 1403 Cypress St
- 1404 Birney St
- 1737 Newberry St
- 1717 Ottawa St
- 828 Malzahn St
- 1902 Newberry St
- 1111 Wright St
- 1710 Gratiot Ave
- 713 S Woodbridge St
- 813 S Mason St
- 2011 Brockway St
- 254 Lockwood St
- 1617 Van Buren St
- 4 Roethke Ct
- 1827 Gratiot Ave