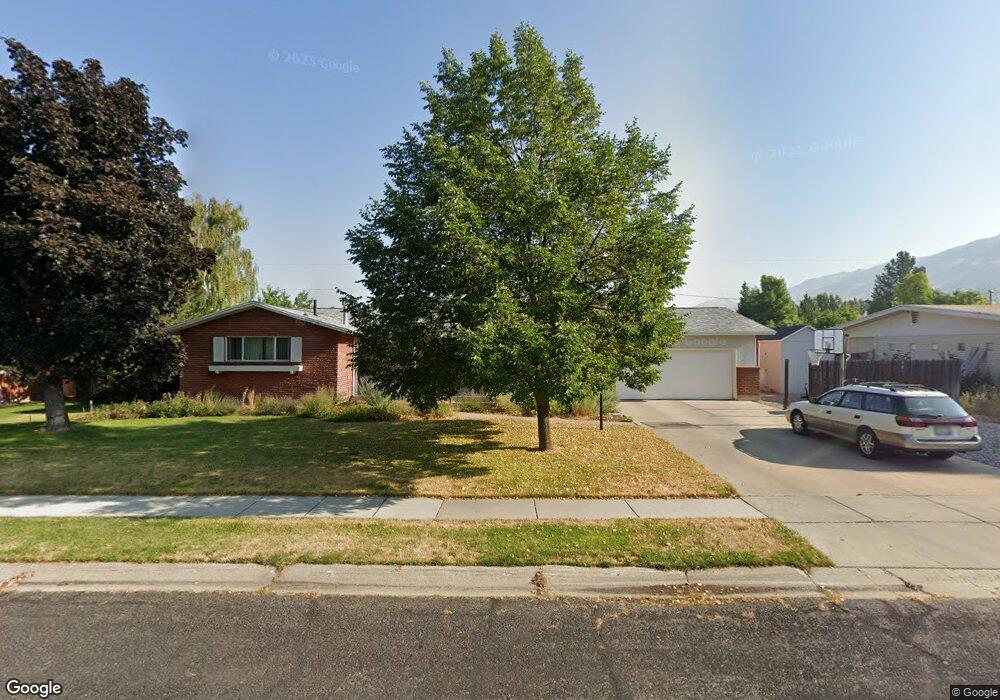
1553 E 1220 N Logan, UT 84341
Hillcrest NeighborhoodEstimated Value: $522,000 - $580,000
Studio
--
Bath
1,618
Sq Ft
$336/Sq Ft
Est. Value
About This Home
This home is located at 1553 E 1220 N, Logan, UT 84341 and is currently estimated at $543,808, approximately $336 per square foot. 1553 E 1220 N is a home with nearby schools including Hillcrest Elementary School, Mount Logan Middle School, and Logan High School.
Ownership History
Date
Name
Owned For
Owner Type
Purchase Details
Closed on
Jul 15, 2020
Sold by
Smith Clifford Jack and Smith Tamara Davenport
Bought by
Smith Clifford and Smith Tamara
Current Estimated Value
Home Financials for this Owner
Home Financials are based on the most recent Mortgage that was taken out on this home.
Original Mortgage
$88,000
Outstanding Balance
$45,199
Interest Rate
3.1%
Mortgage Type
New Conventional
Estimated Equity
$498,609
Purchase Details
Closed on
Jan 24, 2013
Sold by
Smith Clifford Jack and Smith Tamara D
Bought by
Smith Clifford and Smith Tamara
Purchase Details
Closed on
Apr 18, 2002
Sold by
Griffin Gerald D
Bought by
Smith Clifford Jack and Smith Tamara D
Home Financials for this Owner
Home Financials are based on the most recent Mortgage that was taken out on this home.
Original Mortgage
$142,800
Interest Rate
6.87%
Create a Home Valuation Report for This Property
The Home Valuation Report is an in-depth analysis detailing your home's value as well as a comparison with similar homes in the area
Home Values in the Area
Average Home Value in this Area
Purchase History
| Date | Buyer | Sale Price | Title Company |
|---|---|---|---|
| Smith Clifford | -- | Inwest Title Services Inc | |
| Smith Clifford Jack | -- | Inwest Title Services Inc | |
| Smith Clifford | -- | None Available | |
| Smith Clifford Jack | -- | Advanced Title Co |
Source: Public Records
Mortgage History
| Date | Status | Borrower | Loan Amount |
|---|---|---|---|
| Open | Smith Clifford Jack | $88,000 | |
| Closed | Smith Clifford Jack | $142,800 |
Source: Public Records
Tax History
| Year | Tax Paid | Tax Assessment Tax Assessment Total Assessment is a certain percentage of the fair market value that is determined by local assessors to be the total taxable value of land and additions on the property. | Land | Improvement |
|---|---|---|---|---|
| 2025 | $2,217 | $286,720 | $0 | $0 |
| 2024 | $2,289 | $286,720 | $0 | $0 |
| 2023 | $2,390 | $285,400 | $0 | $0 |
| 2022 | $2,288 | $255,150 | $0 | $0 |
| 2021 | $2,093 | $360,490 | $65,000 | $295,490 |
| 2020 | $1,885 | $292,300 | $65,000 | $227,300 |
| 2019 | $1,971 | $292,300 | $65,000 | $227,300 |
| 2018 | $1,669 | $226,056 | $65,000 | $161,056 |
| 2017 | $1,458 | $104,390 | $0 | $0 |
| 2016 | $1,512 | $104,390 | $0 | $0 |
| 2015 | $1,513 | $104,390 | $0 | $0 |
| 2014 | $1,368 | $104,390 | $0 | $0 |
| 2013 | -- | $102,775 | $0 | $0 |
Source: Public Records
Map
Nearby Homes
- 1512 E 1260 N
- 1133 N 1520 E
- 1535 E 1385 N
- 1357 E 1220 N
- 1450 N 1525 E
- 1440 N 1600 E
- 1782 E 1250 N
- 1454 N 1400 E
- 1354 N 1250 E Unit 46
- 1336 E Talmage Ln Unit 38
- 1341 N 1250 E Unit 41
- 1374 N 1250 E Unit 48
- 1405 N Aspen Dr
- 866 Hillcrest Ave
- 825 N 1400 E
- 1451 N Aspen Dr
- 1475 N Aspen Dr Unit 16
- 1902 E 1500 N
- 1586 N Sharptail Cir
- 1374 Maple Dr
Your Personal Tour Guide
Ask me questions while you tour the home.