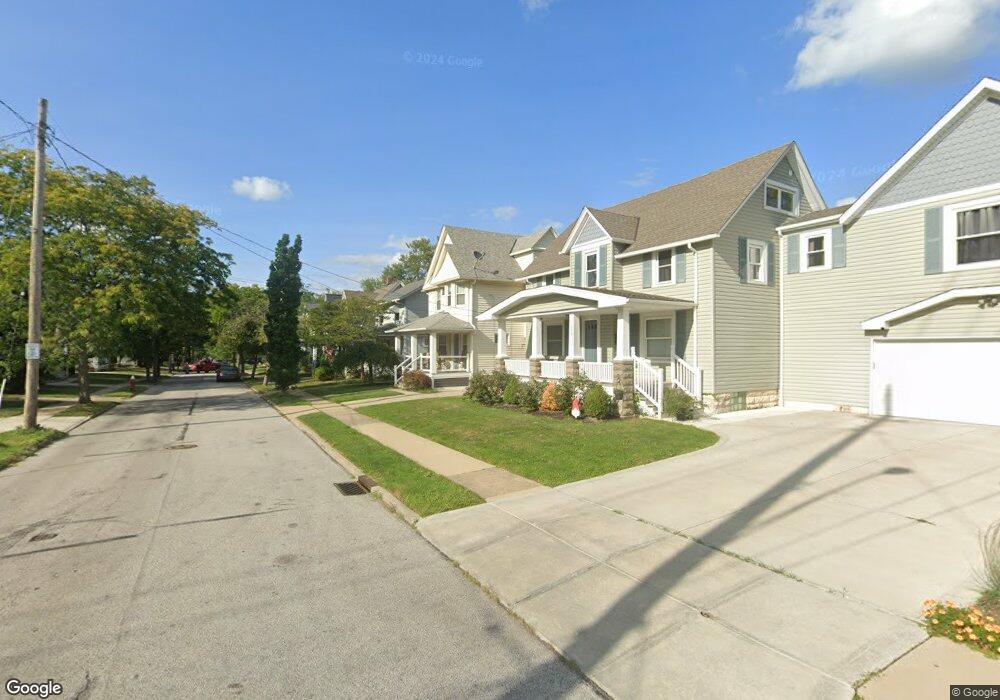
1553 Rockway Ave Lakewood, OH 44107
Estimated Value: $312,000 - $352,000
3
Beds
2
Baths
1,298
Sq Ft
$250/Sq Ft
Est. Value
About This Home
This home is located at 1553 Rockway Ave, Lakewood, OH 44107 and is currently estimated at $323,994, approximately $249 per square foot. 1553 Rockway Ave is a home located in Cuyahoga County with nearby schools including Horace Mann Elementary School, Harding Middle School, and Lakewood High School.
Ownership History
Date
Name
Owned For
Owner Type
Purchase Details
Closed on
Feb 8, 2018
Sold by
Virzi Nick
Bought by
Nick Virzi Llc
Current Estimated Value
Purchase Details
Closed on
May 26, 2009
Sold by
Mcintyre Mark A and Mcintyre Gail S
Bought by
Virzi Nick
Home Financials for this Owner
Home Financials are based on the most recent Mortgage that was taken out on this home.
Original Mortgage
$85,500
Outstanding Balance
$54,224
Interest Rate
4.84%
Mortgage Type
Purchase Money Mortgage
Estimated Equity
$269,770
Purchase Details
Closed on
Mar 13, 1991
Sold by
Boehm Cathy 1 and Boehm 7
Bought by
Mcintyre Mark A
Purchase Details
Closed on
Oct 15, 1990
Sold by
Gerhart Link
Bought by
Boehm Cathy 1 and Boehm 7
Purchase Details
Closed on
Jul 14, 1980
Sold by
Link Gerhart W and Link Ruth
Bought by
Gerhart Link
Purchase Details
Closed on
Jan 1, 1975
Bought by
Link Gerhart W and Link Ruth
Create a Home Valuation Report for This Property
The Home Valuation Report is an in-depth analysis detailing your home's value as well as a comparison with similar homes in the area
Home Values in the Area
Average Home Value in this Area
Purchase History
| Date | Buyer | Sale Price | Title Company |
|---|---|---|---|
| Nick Virzi Llc | -- | None Available | |
| Virzi Nick | $95,000 | New Market Title Llc | |
| Mcintyre Mark A | $59,900 | -- | |
| Boehm Cathy 1 | -- | -- | |
| Gerhart Link | -- | -- | |
| Link Gerhart W | -- | -- |
Source: Public Records
Mortgage History
| Date | Status | Borrower | Loan Amount |
|---|---|---|---|
| Open | Virzi Nick | $85,500 |
Source: Public Records
Tax History Compared to Growth
Tax History
| Year | Tax Paid | Tax Assessment Tax Assessment Total Assessment is a certain percentage of the fair market value that is determined by local assessors to be the total taxable value of land and additions on the property. | Land | Improvement |
|---|---|---|---|---|
| 2024 | $6,627 | $100,905 | $18,340 | $82,565 |
| 2023 | $4,741 | $61,780 | $14,180 | $47,600 |
| 2022 | $4,772 | $61,780 | $14,180 | $47,600 |
| 2021 | $4,726 | $61,780 | $14,180 | $47,600 |
| 2020 | $3,970 | $45,360 | $10,990 | $34,370 |
| 2019 | $3,897 | $129,600 | $31,400 | $98,200 |
| 2018 | $3,362 | $45,360 | $10,990 | $34,370 |
| 2017 | $3,115 | $33,810 | $8,960 | $24,850 |
| 2016 | $3,094 | $33,810 | $8,960 | $24,850 |
| 2015 | $3,244 | $35,630 | $8,960 | $26,670 |
| 2014 | $3,244 | $34,060 | $8,160 | $25,900 |
Source: Public Records
Map
Nearby Homes
- 17322 Archdale Ave
- 1482 Rockway Ave
- 1462 Spring Garden Ave
- 1500 Lauderdale Ave
- 1464 Riverside Dr
- 1431 Maile Ave
- 1420 Cordova Ave
- 1563 Wagar Ave
- 1615 Wagar Ave
- 1354 Webb Rd
- 2111 Overbrook Ave
- 1422 Gridley St
- 1416 Rio St
- 1437 Woodward Ave
- 18239 Sloane Ave
- 1547 Orchard Grove Ave
- 1507 Orchard Grove Ave
- 1431 Northland Ave
- 1279 Arlington Rd
- 1350 Edanola Ave
- 1549 Rockway Ave
- 1557 Rockway Ave
- 1545 Rockway Ave
- 1556 Spring Garden Ave
- 1560 1562 Spring Garden Ave
- 1560 Spring Garden Ave
- 1560 Spring Garden Ave Unit Lower
- 1560 Spring Garden Ave Unit Upper
- 1539 Rockway Ave
- 1552 Spring Garden Ave
- 1564 Spring Garden Ave
- 1548 Rockway Ave
- 17614 Franklin Ave
- 17618 Franklin Ave
- 1548 Spring Garden Ave
- 17610 Franklin Ave
- 1556 Rockway Ave
- 1535 Rockway Ave
- 17604 Franklin Ave
- 17606 Franklin Ave Unit 17606 Franklin Ave FL 3