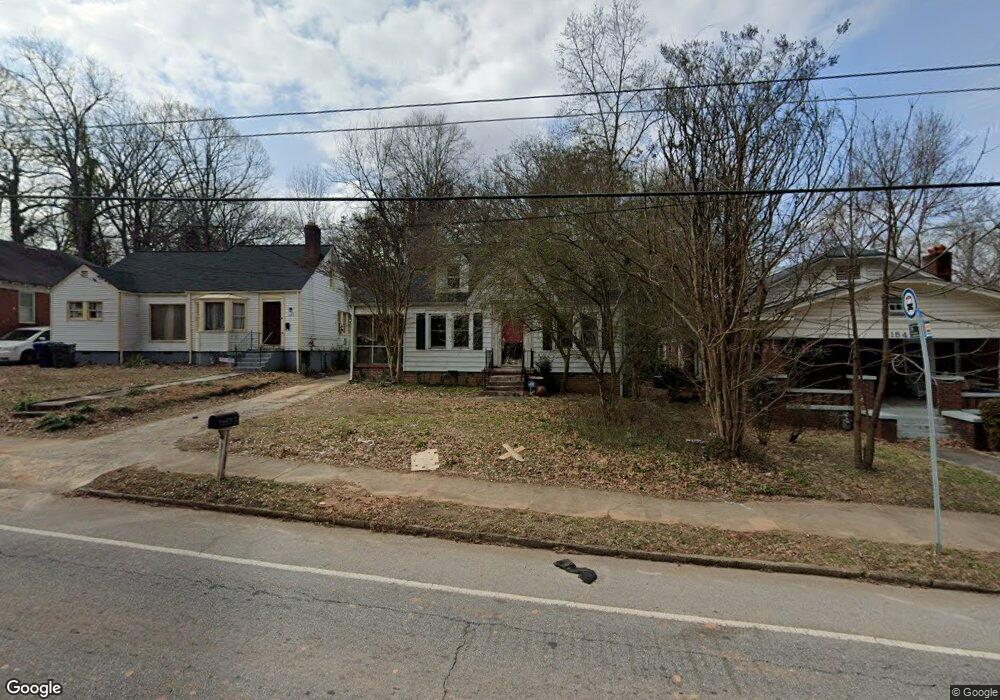
1553 Sylvan Rd SW Atlanta, GA 30310
Sylvan Hills NeighborhoodEstimated Value: $224,000 - $332,000
3
Beds
2
Baths
1,653
Sq Ft
$168/Sq Ft
Est. Value
About This Home
This home is located at 1553 Sylvan Rd SW, Atlanta, GA 30310 and is currently estimated at $278,009, approximately $168 per square foot. 1553 Sylvan Rd SW is a home located in Fulton County with nearby schools including Perkerson Elementary School, Sylvan Hills Middle School, and Carver High School.
Ownership History
Date
Name
Owned For
Owner Type
Purchase Details
Closed on
Dec 12, 2008
Sold by
Argent Series 2005 & W1
Bought by
Williams Troy
Current Estimated Value
Purchase Details
Closed on
Oct 2, 2007
Sold by
Mapp Albert
Bought by
Argent Mtg Loan Asset & Backed N
Purchase Details
Closed on
Nov 13, 1997
Sold by
Harvest Mtg Co Inc
Bought by
Jamerson Michael
Home Financials for this Owner
Home Financials are based on the most recent Mortgage that was taken out on this home.
Original Mortgage
$78,400
Interest Rate
7.38%
Mortgage Type
New Conventional
Purchase Details
Closed on
Mar 29, 1994
Sold by
Rodkin Warren
Bought by
Mapp Albert
Home Financials for this Owner
Home Financials are based on the most recent Mortgage that was taken out on this home.
Original Mortgage
$49,500
Interest Rate
7.1%
Create a Home Valuation Report for This Property
The Home Valuation Report is an in-depth analysis detailing your home's value as well as a comparison with similar homes in the area
Home Values in the Area
Average Home Value in this Area
Purchase History
| Date | Buyer | Sale Price | Title Company |
|---|---|---|---|
| Williams Troy | $28,000 | -- | |
| Argent Mtg Loan Asset & Backed N | $169,936 | -- | |
| Jamerson Michael | $98,000 | -- | |
| Mapp Albert | $55,000 | -- |
Source: Public Records
Mortgage History
| Date | Status | Borrower | Loan Amount |
|---|---|---|---|
| Previous Owner | Jamerson Michael | $78,400 | |
| Previous Owner | Mapp Albert | $49,500 |
Source: Public Records
Tax History Compared to Growth
Tax History
| Year | Tax Paid | Tax Assessment Tax Assessment Total Assessment is a certain percentage of the fair market value that is determined by local assessors to be the total taxable value of land and additions on the property. | Land | Improvement |
|---|---|---|---|---|
| 2025 | $3,332 | $80,400 | $23,160 | $57,240 |
| 2023 | $4,117 | $99,440 | $46,040 | $53,400 |
| 2022 | $3,038 | $75,080 | $23,640 | $51,440 |
| 2021 | $2,896 | $59,440 | $12,520 | $46,920 |
| 2020 | $2,406 | $58,720 | $12,360 | $46,360 |
| 2019 | $485 | $36,280 | $9,400 | $26,880 |
| 2018 | $869 | $21,000 | $4,760 | $16,240 |
| 2017 | $599 | $13,880 | $2,880 | $11,000 |
| 2016 | $601 | $13,880 | $2,880 | $11,000 |
| 2015 | $1,071 | $13,880 | $2,880 | $11,000 |
| 2014 | $629 | $13,880 | $2,880 | $11,000 |
Source: Public Records
Map
Nearby Homes
- 948 Byron Dr SW
- 934 Burns Dr SW
- 944 Deckner Ave SW
- 978 Byron Dr SW
- 1520 Brewer Blvd SW
- 818 Burchill St SW
- 819 Blossom St SW
- 1470 Hartford Ave SW
- 1653 Sylvan Rd SW
- 818 Braddock St SW
- 1423 Graham St SW
- 1423 Fairbanks St SW
- 1405 Graham St SW
- 1395 Hartford Ave SW
- 1696 Langston Ave SW
- 1440 Everhart St SW
- 999 Arden Ave SW
- 939 Hope Dr SW
- 794 Casplan St SW
- 964 Dill Ave SW
- 1557 Sylvan Rd SW
- 1547 Sylvan Rd SW
- 1563 Sylvan Rd SW
- 936 Byron Dr SW
- 935 Burns Dr SW
- 939 Burns Dr SW
- 921 Byron Dr SW
- 1571 Sylvan Rd SW
- 927 Byron Dr SW
- 1558 Sylvan Rd SW Unit 1
- 1548 Sylvan Rd SW
- 1564 Sylvan Rd SW
- 948 Byron Dr SW Unit 40
- 933 Byron Dr SW
- 945 Burns Dr SW
- 1577 Sylvan Rd SW
- 939 Byron Dr SW
- 1570 Sylvan Rd SW
- 1527 Sylvan Rd SW
- 954 Byron Dr SW