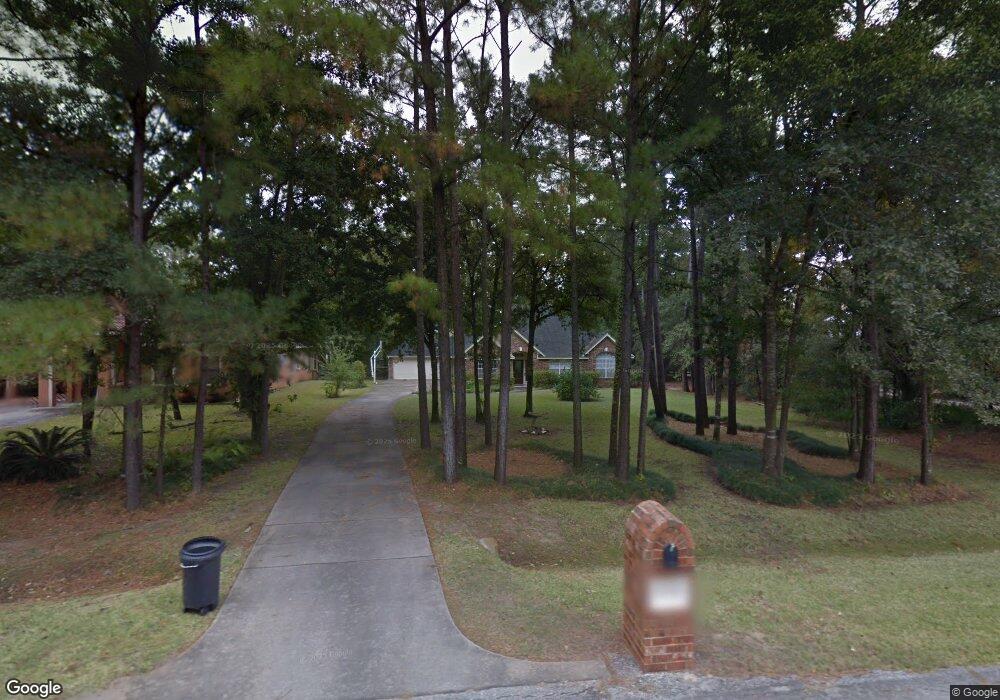
15530 Waldwick Dr Tomball, TX 77377
Estimated Value: $318,000 - $363,000
4
Beds
3
Baths
2,425
Sq Ft
$141/Sq Ft
Est. Value
About This Home
This home is located at 15530 Waldwick Dr, Tomball, TX 77377 and is currently estimated at $342,576, approximately $141 per square foot. 15530 Waldwick Dr is a home located in Harris County with nearby schools including Lakewood Elementary School, Willow Wood Junior High School, and Northpointe Intermediate School.
Ownership History
Date
Name
Owned For
Owner Type
Purchase Details
Closed on
Jul 26, 2002
Sold by
Peel Robert William and Peel Shirlene Tina
Bought by
Krueger James and Krueger Sylvia
Current Estimated Value
Home Financials for this Owner
Home Financials are based on the most recent Mortgage that was taken out on this home.
Original Mortgage
$164,000
Interest Rate
6.69%
Purchase Details
Closed on
Oct 28, 1994
Sold by
Sycamore Investment Company
Bought by
Peel Robert William and Peel Shirlene Tina
Home Financials for this Owner
Home Financials are based on the most recent Mortgage that was taken out on this home.
Original Mortgage
$135,500
Interest Rate
8.62%
Purchase Details
Closed on
May 20, 1994
Sold by
Gordon Charles and Gordon Sara
Bought by
Peel Robert W and Peel Shirlene T
Create a Home Valuation Report for This Property
The Home Valuation Report is an in-depth analysis detailing your home's value as well as a comparison with similar homes in the area
Home Values in the Area
Average Home Value in this Area
Purchase History
| Date | Buyer | Sale Price | Title Company |
|---|---|---|---|
| Krueger James | -- | -- | |
| Peel Robert William | -- | -- | |
| Peel Robert W | -- | Stewart Title |
Source: Public Records
Mortgage History
| Date | Status | Borrower | Loan Amount |
|---|---|---|---|
| Previous Owner | Krueger James | $164,000 | |
| Previous Owner | Peel Robert William | $135,500 |
Source: Public Records
Tax History Compared to Growth
Tax History
| Year | Tax Paid | Tax Assessment Tax Assessment Total Assessment is a certain percentage of the fair market value that is determined by local assessors to be the total taxable value of land and additions on the property. | Land | Improvement |
|---|---|---|---|---|
| 2025 | $759 | $238,835 | $52,415 | $186,420 |
| 2024 | $759 | $238,835 | $52,415 | $186,420 |
| 2023 | $759 | $243,669 | $52,415 | $191,254 |
| 2022 | $4,860 | $243,669 | $52,415 | $191,254 |
| 2021 | $4,892 | $243,669 | $52,415 | $191,254 |
| 2020 | $4,608 | $254,762 | $52,415 | $202,347 |
| 2019 | $4,325 | $194,901 | $50,509 | $144,392 |
| 2018 | $1,848 | $194,901 | $50,509 | $144,392 |
| 2017 | $4,316 | $194,901 | $50,509 | $144,392 |
| 2016 | $4,316 | $194,901 | $50,509 | $144,392 |
| 2015 | $4,314 | $194,901 | $50,509 | $144,392 |
| 2014 | $4,314 | $214,662 | $26,684 | $187,978 |
Source: Public Records
Map
Nearby Homes
- 15522 Waldwick Dr
- 15418 Waldwick Dr
- 15603 Lakewood Terrace Dr
- 15703 Downford Dr
- 11802 Laurel Meadow Dr
- 15603 Canterbury Forest Dr
- 11707 Hillbrook Dr
- 11606 Gatesden Dr
- 15326 Gettysburg Dr
- 15627 Gettysburg Dr
- 15420 Winterhaven Dr
- 11614 Brookfalls Dr
- 15406 Winterhaven Dr
- 11510 Maple Falls Dr
- 15627 Lago Villa Dr
- 15207 Hillbrook Ct
- 15214 River Park Dr
- 11410 Rothglen St
- 15902 Timber Grove Ct
- 15118 Stillcreek Dr
- 15514 Waldwick Dr
- 15502 Waldwick Dr
- 15511 Lakewood Terrace Dr
- 15507 Lakewood Terrace Dr
- 15515 Lakewood Terrace Dr
- 15503 Lakewood Terrace Dr
- 15519 Lakewood Terrace Dr
- 15443 Lakewood Terrace Dr
- 15523 Lakewood Terrace Dr
- 15439 Lakewood Terrace Dr
- 15527 Lakewood Terrace Dr
- 15435 Lakewood Terrace Dr
- 0 Waldwick Dr
- 15515 Waldwick Dr
- 15531 Lakewood Terrace Dr
- 11710 Thornwood Run Ln
- 15503 Waldwick Dr
- 11711 Rosehall Reach Ln
- 15431 Lakewood Terrace Dr
- 15535 Lakewood Terrace Dr