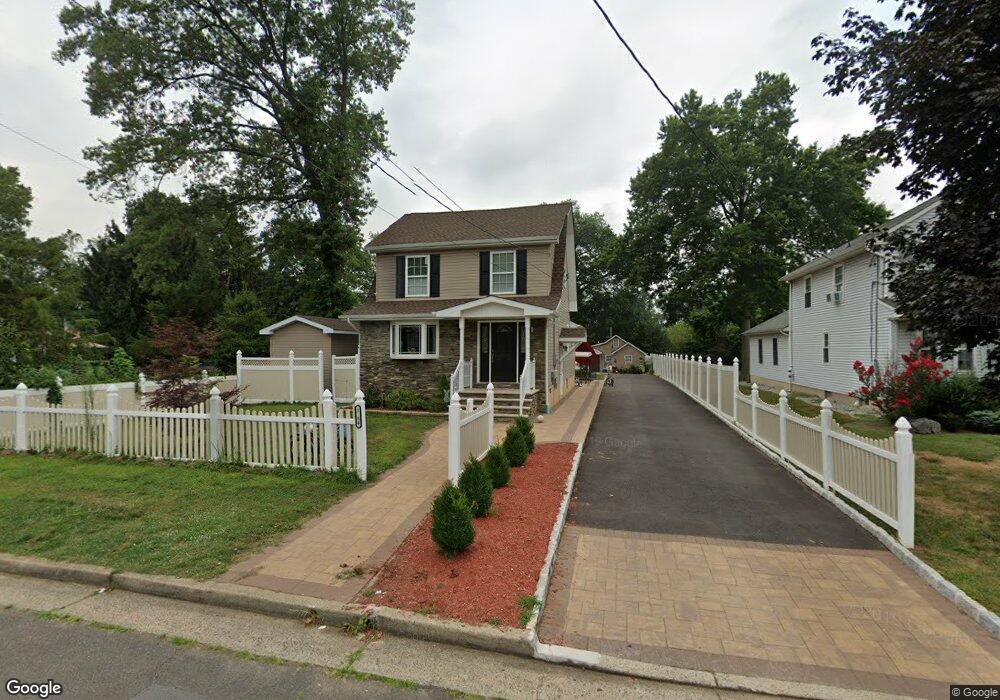
1554 Dumont Ave South Plainfield, NJ 07080
Estimated Value: $492,000 - $583,000
3
Beds
1
Bath
1,072
Sq Ft
$505/Sq Ft
Est. Value
About This Home
This home is located at 1554 Dumont Ave, South Plainfield, NJ 07080 and is currently estimated at $541,700, approximately $505 per square foot. 1554 Dumont Ave is a home located in Middlesex County with nearby schools including South Plainfield High School, The Queen City Academy Charter School, and Holy Savior Academy.
Ownership History
Date
Name
Owned For
Owner Type
Purchase Details
Closed on
Feb 21, 2017
Sold by
Londono Vanessa
Bought by
Londono Vanessa
Current Estimated Value
Home Financials for this Owner
Home Financials are based on the most recent Mortgage that was taken out on this home.
Interest Rate
4.15%
Purchase Details
Closed on
Oct 8, 2015
Sold by
Bank Of America Na
Bought by
Londono Vanessa
Purchase Details
Closed on
May 13, 2015
Sold by
Zrinko Frank J and Zrinko Susan
Bought by
Bank Of America Na
Purchase Details
Closed on
May 18, 2006
Sold by
Ensign Shona
Bought by
Zrinko Frank and Zrinko Susan
Home Financials for this Owner
Home Financials are based on the most recent Mortgage that was taken out on this home.
Original Mortgage
$350,000
Interest Rate
9.4%
Mortgage Type
Adjustable Rate Mortgage/ARM
Create a Home Valuation Report for This Property
The Home Valuation Report is an in-depth analysis detailing your home's value as well as a comparison with similar homes in the area
Home Values in the Area
Average Home Value in this Area
Purchase History
| Date | Buyer | Sale Price | Title Company |
|---|---|---|---|
| Londono Vanessa | -- | -- | |
| Londono Vanessa | $117,500 | Servicelink Llc | |
| Bank Of America Na | $524,385 | None Available | |
| Zrinko Frank | $350,000 | -- |
Source: Public Records
Mortgage History
| Date | Status | Borrower | Loan Amount |
|---|---|---|---|
| Closed | Londono Vanessa | -- | |
| Previous Owner | Zrinko Frank | $350,000 |
Source: Public Records
Tax History Compared to Growth
Tax History
| Year | Tax Paid | Tax Assessment Tax Assessment Total Assessment is a certain percentage of the fair market value that is determined by local assessors to be the total taxable value of land and additions on the property. | Land | Improvement |
|---|---|---|---|---|
| 2025 | $10,170 | $145,660 | $34,600 | $111,060 |
| 2024 | $9,727 | $145,660 | $34,600 | $111,060 |
| 2023 | $9,727 | $145,660 | $34,600 | $111,060 |
| 2022 | $9,606 | $145,660 | $34,600 | $111,060 |
| 2021 | $9,381 | $145,660 | $34,600 | $111,060 |
| 2020 | $9,244 | $145,660 | $34,600 | $111,060 |
| 2019 | $8,869 | $145,660 | $34,600 | $111,060 |
| 2018 | $8,641 | $145,660 | $34,600 | $111,060 |
| 2017 | $6,846 | $116,900 | $34,600 | $82,300 |
| 2016 | $6,777 | $116,900 | $34,600 | $82,300 |
| 2015 | $6,660 | $116,900 | $34,600 | $82,300 |
| 2014 | $6,468 | $116,900 | $34,600 | $82,300 |
Source: Public Records
Map
Nearby Homes
- 1560 Dumont Ave
- 1562 Dumont Ave
- 1562 Dumont Ave Unit 14.02
- 1559 Dumont Ave
- 1553 Dumont Ave
- 1544 Dumont Ave
- 1544 Dumont Ave Unit 2
- 1563 Dumont Ave
- 1549 Dumont Ave
- 1574 Dumont Ave
- 1540 Dumont Ave
- 1543 Dumont Ave
- 1569 Dumont Ave
- 1541 Dumont Ave
- 1534 Dumont Ave
- 1212 Cherry St
- 1621 Windrew Ave
- 1625 Windrew Ave
- 1613 Windrew Ave
- 1535 Dumont Ave