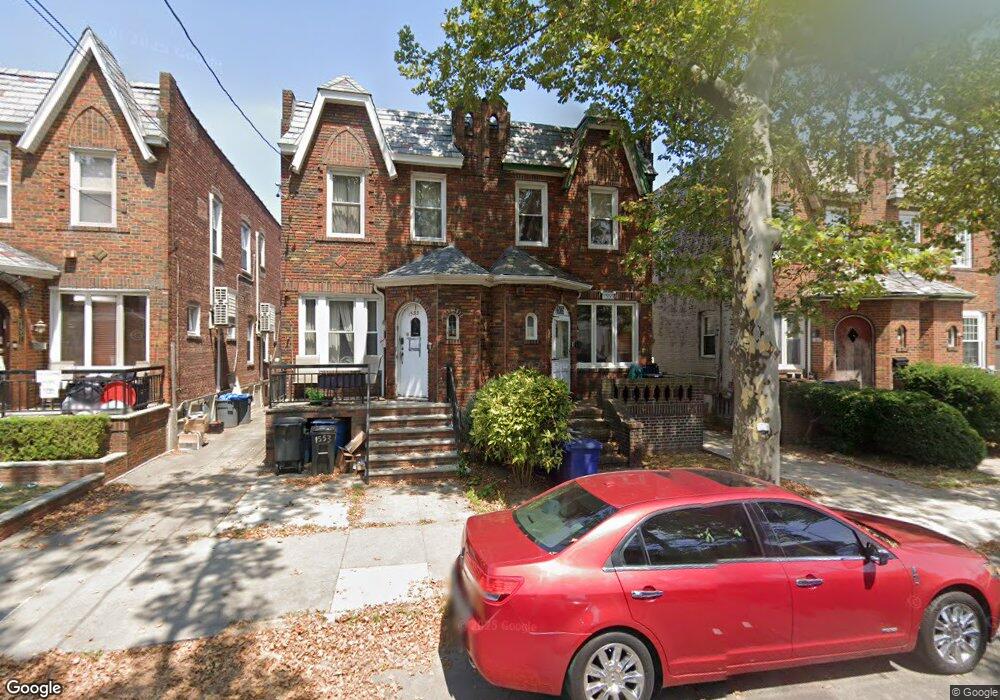
1555 E 35th St Brooklyn, NY 11234
Marine Park NeighborhoodEstimated Value: $837,710 - $1,008,000
Studio
--
Bath
1,600
Sq Ft
$572/Sq Ft
Est. Value
About This Home
This home is located at 1555 E 35th St, Brooklyn, NY 11234 and is currently estimated at $915,678, approximately $572 per square foot. 1555 E 35th St is a home located in Kings County with nearby schools including PS 222 Katherine R Snyder, J.H.S. 278 Marine Park, and James Madison High School.
Ownership History
Date
Name
Owned For
Owner Type
Purchase Details
Closed on
Jul 13, 1999
Sold by
Parry Joan
Bought by
Gross Joseph and Gross Rene
Current Estimated Value
Home Financials for this Owner
Home Financials are based on the most recent Mortgage that was taken out on this home.
Original Mortgage
$196,200
Interest Rate
7.8%
Purchase Details
Closed on
Apr 14, 1998
Sold by
Gross Rose
Bought by
Parry Joan and Bially Phyllis
Create a Home Valuation Report for This Property
The Home Valuation Report is an in-depth analysis detailing your home's value as well as a comparison with similar homes in the area
Home Values in the Area
Average Home Value in this Area
Purchase History
| Date | Buyer | Sale Price | Title Company |
|---|---|---|---|
| Gross Joseph | $218,000 | Chicago Title Insurance Co | |
| Parry Joan | -- | -- |
Source: Public Records
Mortgage History
| Date | Status | Borrower | Loan Amount |
|---|---|---|---|
| Previous Owner | Gross Joseph | $196,200 |
Source: Public Records
Tax History
| Year | Tax Paid | Tax Assessment Tax Assessment Total Assessment is a certain percentage of the fair market value that is determined by local assessors to be the total taxable value of land and additions on the property. | Land | Improvement |
|---|---|---|---|---|
| 2025 | $7,077 | $45,720 | $9,720 | $36,000 |
| 2024 | $7,077 | $39,720 | $9,720 | $30,000 |
| 2023 | $7,155 | $37,140 | $9,720 | $27,420 |
| 2022 | $6,980 | $37,680 | $9,720 | $27,960 |
| 2021 | $6,942 | $39,660 | $9,720 | $29,940 |
| 2019 | $6,142 | $32,280 | $9,720 | $22,560 |
| 2018 | $5,985 | $29,361 | $6,766 | $22,595 |
| 2017 | $5,940 | $29,138 | $7,841 | $21,297 |
| 2016 | $5,495 | $27,489 | $8,630 | $18,859 |
| 2015 | $3,315 | $25,934 | $9,645 | $16,289 |
| 2014 | $3,315 | $24,468 | $8,808 | $15,660 |
Source: Public Records
Map
Nearby Homes
- 1569 E 34th St
- 1443 E 35th St
- 1523 E 33rd St
- 3222 Kings Hwy
- 3414 Avenue P
- 3152 Kings Hwy
- 3117 Kings Hwy
- 3115 Kings Hwy
- 3524 Avenue M
- 1638 E 36th St
- 1632 E 38th St
- 1509 E 31st St
- 1649 E 37th St
- 1513 Kimball St
- 1664 E 35th St
- 1627 E 32nd St
- 3617 Quentin Rd
- 3626 Kings Hwy
- 3626 Kings Hwy Unit 6C
- 1344 E 35th St
Your Personal Tour Guide
Ask me questions while you tour the home.