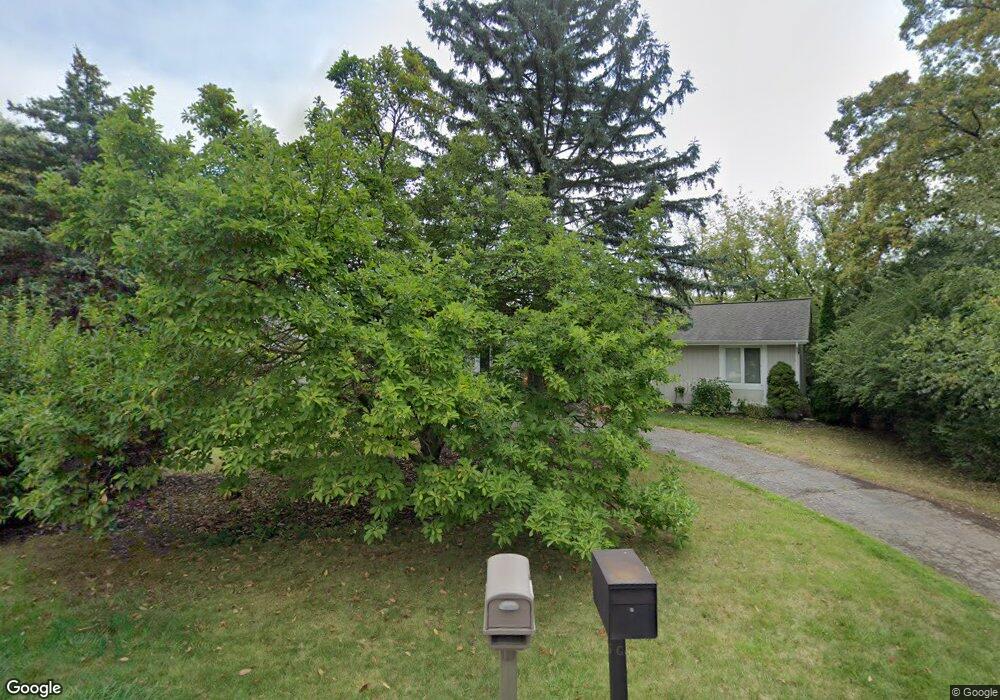
1555 Groton Rd Bloomfield Hills, MI 48302
Estimated Value: $645,866 - $749,000
4
Beds
2
Baths
2,295
Sq Ft
$307/Sq Ft
Est. Value
About This Home
This home is located at 1555 Groton Rd, Bloomfield Hills, MI 48302 and is currently estimated at $703,467, approximately $306 per square foot. 1555 Groton Rd is a home located in Oakland County with nearby schools including Conant Elementary School, South Hills Middle School, and Bloomfield Hills High School.
Ownership History
Date
Name
Owned For
Owner Type
Purchase Details
Closed on
Aug 30, 2013
Sold by
Bouch Anne
Bought by
Hinton Marian and Hinton Benjamin
Current Estimated Value
Purchase Details
Closed on
Sep 14, 2012
Sold by
Bouch Anne and Bouch Brendan
Bought by
Bouch Anne
Purchase Details
Closed on
Aug 13, 2002
Sold by
Bouch Trust
Bought by
Bouch Brendan S
Home Financials for this Owner
Home Financials are based on the most recent Mortgage that was taken out on this home.
Original Mortgage
$172,800
Interest Rate
6.41%
Purchase Details
Closed on
Jun 26, 2001
Sold by
Bouch Brendan S
Bought by
Bouch Trust
Create a Home Valuation Report for This Property
The Home Valuation Report is an in-depth analysis detailing your home's value as well as a comparison with similar homes in the area
Home Values in the Area
Average Home Value in this Area
Purchase History
| Date | Buyer | Sale Price | Title Company |
|---|---|---|---|
| Hinton Marian | $300,000 | Sterling Title Agency | |
| Bouch Anne | -- | None Available | |
| Bouch Brendan S | -- | -- | |
| Bouch Trust | -- | -- |
Source: Public Records
Mortgage History
| Date | Status | Borrower | Loan Amount |
|---|---|---|---|
| Previous Owner | Bouch Brendan S | $172,800 |
Source: Public Records
Tax History Compared to Growth
Tax History
| Year | Tax Paid | Tax Assessment Tax Assessment Total Assessment is a certain percentage of the fair market value that is determined by local assessors to be the total taxable value of land and additions on the property. | Land | Improvement |
|---|---|---|---|---|
| 2024 | $3,539 | $301,010 | $0 | $0 |
| 2023 | $3,425 | $271,540 | $0 | $0 |
| 2022 | $6,436 | $247,520 | $0 | $0 |
| 2021 | $6,390 | $214,560 | $0 | $0 |
| 2020 | $3,132 | $227,630 | $0 | $0 |
| 2019 | $6,013 | $204,340 | $0 | $0 |
| 2018 | $6,040 | $199,470 | $0 | $0 |
| 2017 | $5,997 | $192,970 | $0 | $0 |
| 2016 | $6,009 | $186,850 | $0 | $0 |
| 2015 | -- | $160,260 | $0 | $0 |
| 2014 | -- | $150,350 | $0 | $0 |
| 2011 | -- | $137,320 | $0 | $0 |
Source: Public Records
Map
Nearby Homes
- 4123 Chimney Point Dr
- 1347 N Carillon Ct
- 4535 Grindley Ct
- 1462 Sodon Ct
- 00 Mohawk Ct
- 2668 Turtle Lake
- VL Lahser Road Lot 76
- 0001 Mohawk Ct
- 1214 Copperwood Dr
- 1567 Island Ln
- 1732 Blair House Ct
- 1715 Lone Pine Rd
- 1795 Golf Ridge Dr Unit 19
- 1612 Apple Ln
- 5148 Crest Knolls Ct
- 5190 Clarendon Crest St
- 5008 Kings Gate Way
- 4255 Telegraph Rd
- 1907 Raymond Place
- 921 Pine Thistle Ln
- 1563 Groton Rd
- 1550 Groton Rd
- 1539 Groton Rd
- 1562 Groton Rd
- 4251 Derry Rd
- 1530 Groton Rd
- 4226 Derry Rd
- 1574 Groton Rd
- 1529 Groton Rd
- 4252 Derry Rd
- 1524 Groton Rd
- 1547 W Long Lake Rd
- 4294 Pine Tree Trail
- 4225 Franklin Rd
- 1559 W Long Lake Rd
- 1535 W Long Lake Rd Unit Bldg-Unit
- 4332 Pine Tree Trail
- 4276 Derry Rd
- 4251 Franklin Rd
- 4301 Derry Rd