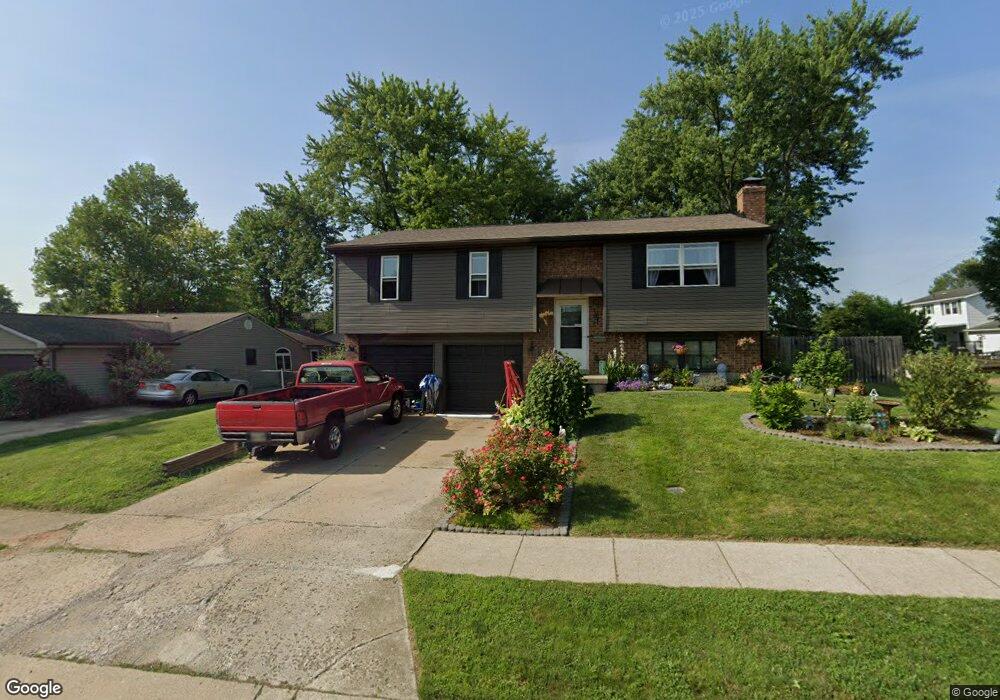
1555 Leis Rd Miamisburg, OH 45342
Estimated Value: $209,000 - $264,000
3
Beds
2
Baths
1,028
Sq Ft
$228/Sq Ft
Est. Value
About This Home
This home is located at 1555 Leis Rd, Miamisburg, OH 45342 and is currently estimated at $234,846, approximately $228 per square foot. 1555 Leis Rd is a home located in Montgomery County with nearby schools including Miamisburg High School and Bethel Baptist School.
Ownership History
Date
Name
Owned For
Owner Type
Purchase Details
Closed on
Dec 23, 2015
Sold by
Wilmington Savings Fund Society
Bought by
Szeman Jenny
Current Estimated Value
Purchase Details
Closed on
Jul 31, 2014
Sold by
Cox Jeffrey S
Bought by
Christiana Trust
Purchase Details
Closed on
Jan 28, 2010
Sold by
James Nicholas P and James Gaye A
Bought by
Cox Jeffrey S
Home Financials for this Owner
Home Financials are based on the most recent Mortgage that was taken out on this home.
Original Mortgage
$120,772
Interest Rate
5.37%
Mortgage Type
FHA
Purchase Details
Closed on
Dec 22, 2005
Sold by
Cox Jeffrey S and James Gaye A
Bought by
James Nicholas P and James Gaye A
Home Financials for this Owner
Home Financials are based on the most recent Mortgage that was taken out on this home.
Original Mortgage
$22,800
Interest Rate
6.4%
Mortgage Type
Stand Alone Second
Purchase Details
Closed on
Feb 14, 1997
Sold by
Furnas James D and Furnas Vicki L
Bought by
Cox Jeffrey S and Cox Gaye A
Create a Home Valuation Report for This Property
The Home Valuation Report is an in-depth analysis detailing your home's value as well as a comparison with similar homes in the area
Home Values in the Area
Average Home Value in this Area
Purchase History
| Date | Buyer | Sale Price | Title Company |
|---|---|---|---|
| Szeman Jenny | $80,000 | Landcastle Title Llc | |
| Christiana Trust | $84,000 | None Available | |
| Cox Jeffrey S | $123,000 | Attorney | |
| James Nicholas P | $114,000 | None Available | |
| Cox Jeffrey S | $99,900 | -- |
Source: Public Records
Mortgage History
| Date | Status | Borrower | Loan Amount |
|---|---|---|---|
| Previous Owner | Cox Jeffrey S | $120,772 | |
| Previous Owner | James Nicholas P | $22,800 | |
| Previous Owner | James Nicholas P | $91,200 |
Source: Public Records
Tax History Compared to Growth
Tax History
| Year | Tax Paid | Tax Assessment Tax Assessment Total Assessment is a certain percentage of the fair market value that is determined by local assessors to be the total taxable value of land and additions on the property. | Land | Improvement |
|---|---|---|---|---|
| 2024 | $4,354 | $68,570 | $12,250 | $56,320 |
| 2023 | $4,354 | $68,570 | $12,250 | $56,320 |
| 2022 | $3,693 | $48,980 | $8,750 | $40,230 |
| 2021 | $3,266 | $48,980 | $8,750 | $40,230 |
| 2020 | $3,258 | $48,980 | $8,750 | $40,230 |
| 2019 | $3,132 | $43,190 | $8,750 | $34,440 |
| 2018 | $3,143 | $43,190 | $8,750 | $34,440 |
| 2017 | $3,121 | $43,190 | $8,750 | $34,440 |
| 2016 | $2,916 | $37,830 | $8,750 | $29,080 |
| 2015 | $2,782 | $37,830 | $8,750 | $29,080 |
| 2014 | $2,782 | $37,830 | $8,750 | $29,080 |
| 2012 | -- | $39,480 | $10,500 | $28,980 |
Source: Public Records
Map
Nearby Homes
- 1734 Rosina Dr
- 00 Benner Rd
- 1035 Woods View Ct
- 1045 S Linden Ave
- 1013 S Heincke Rd
- 902 Althea Dr
- 1808 Burnside Dr
- Hudson Plan at Deer Valley
- Alberti Ranch Plan at Deer Valley
- Allegheny Plan at Deer Valley
- Bramante Ranch Plan at Deer Valley
- 2127 Carrington Ln
- 807 Dunaway St
- 1265 Deer Valley Dr
- 766 Dunaway St
- 1230 Deer Valley Dr
- 2141 Rosina Dr
- 1126 Terrington Way
- 811 Moon Ct
- 1132 Nouvelle Dr
- 1549 Leis Rd
- 1361 Vista Ridge Dr
- 1351 Vista Ridge Dr
- 1550 Casilla Ct
- 1543 Leis Rd
- 1544 Casilla Ct
- 1341 Vista Ridge Dr
- 4900 Leis Rd
- 1536 Casilla Ct
- 1537 Leis Rd
- 4948 Leis Rd
- 1360 Vista Ridge Dr
- 1350 Vista Ridge Dr
- 1532 Casilla Ct
- 1340 Vista Ridge Dr
- 1531 Leis Rd
- 1555 Casilla Ct
- 1602 Leis Rd
- 1549 Casilla Ct
- 1330 Vista Ridge Dr