Estimated Value: $45,000 - $67,000
2
Beds
1
Bath
736
Sq Ft
$74/Sq Ft
Est. Value
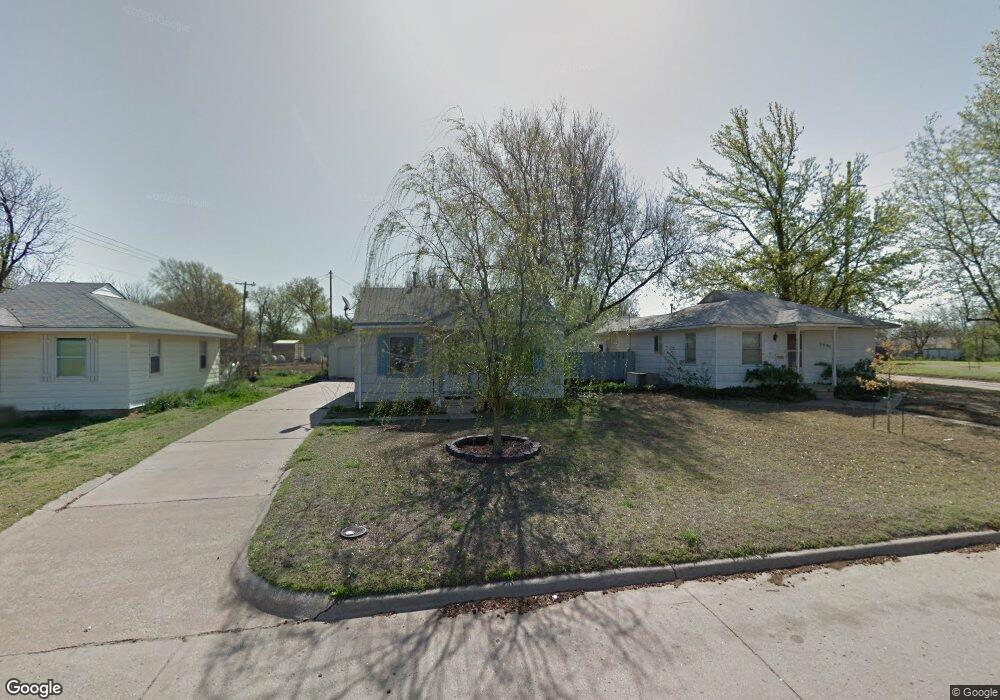
About This Home
This home is located at 1555 N Monroe St, Enid, OK 73701 and is currently estimated at $54,255, approximately $73 per square foot. 1555 N Monroe St is a home located in Garfield County with nearby schools including Monroe Elementary School, Emerson Middle School, and Enid High School.
Ownership History
Date
Name
Owned For
Owner Type
Purchase Details
Closed on
Mar 21, 2023
Sold by
Mchenry Ronald D and Mchenry Shelia
Bought by
Salinas Nikki and Salinas Felipe
Current Estimated Value
Purchase Details
Closed on
Mar 10, 2023
Sold by
Sima Resources Inc
Bought by
Mchenry Ronald D
Purchase Details
Closed on
Jun 4, 2010
Sold by
Silvey Gaylon E
Bought by
Mchenry Ronald D
Home Financials for this Owner
Home Financials are based on the most recent Mortgage that was taken out on this home.
Original Mortgage
$49,335
Interest Rate
5.65%
Mortgage Type
FHA
Purchase Details
Closed on
May 23, 2008
Sold by
Burgess James R and Burgess Janet L
Bought by
Silvey Gaylon E
Home Financials for this Owner
Home Financials are based on the most recent Mortgage that was taken out on this home.
Original Mortgage
$42,827
Interest Rate
6.07%
Mortgage Type
FHA
Purchase Details
Closed on
Jul 27, 1999
Sold by
Wallace Cory G
Bought by
Burgess James R
Create a Home Valuation Report for This Property
The Home Valuation Report is an in-depth analysis detailing your home's value as well as a comparison with similar homes in the area
Home Values in the Area
Average Home Value in this Area
Purchase History
| Date | Buyer | Sale Price | Title Company |
|---|---|---|---|
| Salinas Nikki | $36,000 | -- | |
| Mchenry Ronald D | -- | -- | |
| Mchenry Ronald D | $50,000 | None Available | |
| Silvey Gaylon E | $43,500 | None Available | |
| Burgess James R | $35,000 | -- |
Source: Public Records
Mortgage History
| Date | Status | Borrower | Loan Amount |
|---|---|---|---|
| Previous Owner | Mchenry Ronald D | $49,335 | |
| Previous Owner | Silvey Gaylon E | $42,827 |
Source: Public Records
Tax History Compared to Growth
Tax History
| Year | Tax Paid | Tax Assessment Tax Assessment Total Assessment is a certain percentage of the fair market value that is determined by local assessors to be the total taxable value of land and additions on the property. | Land | Improvement |
|---|---|---|---|---|
| 2024 | $557 | $5,287 | $750 | $4,537 |
| 2023 | $413 | $3,917 | $750 | $3,167 |
| 2022 | $399 | $3,730 | $750 | $2,980 |
| 2021 | $404 | $3,800 | $749 | $3,051 |
| 2020 | $394 | $3,619 | $694 | $2,925 |
| 2019 | $359 | $3,447 | $646 | $2,801 |
| 2018 | $341 | $3,283 | $713 | $2,570 |
| 2017 | $323 | $3,127 | $666 | $2,461 |
| 2016 | $295 | $2,978 | $626 | $2,352 |
| 2015 | $277 | $2,836 | $721 | $2,115 |
| 2014 | $277 | $2,836 | $721 | $2,115 |
Source: Public Records
Map
Nearby Homes
- 1417 N Quincy St
- 1502 N Quincy St
- 501 W Poplar Ave
- 406 W Birch Ave
- 114 W Hemlock Ave
- 709 W Cottonwood Ave
- 115 W Vine Ave
- 2106 N Quincy St
- 2114 N Quincy St
- 705 Magnolia Ave
- 111 and 111 1/2 W Locust
- 606 & 608 W Walnut
- 217 E Cedar Ave
- 354 E Cedar Ave
- 9 W Willow Rd
- 11 W Willow Rd
- 5 W Willow Rd
- 2518 N Adams St
- 1817 Mimosa St
- 342 E Olive St
- 1551 N Monroe St
- 1559 N Monroe St
- 1601 N Monroe St
- 618 W Spruce Ave
- 1605 N Monroe St
- 1556 N Monroe St
- 1560 N Monroe St
- 1564 N Jefferson Place
- 1552 N Monroe St
- 1556 N Jefferson Place
- 621 W Spruce Ave
- 1552 N Jefferson Place
- 1602 N Monroe St
- 1606 N Monroe St
- 1522 N Monroe St
- 1609 N Monroe St
- 611 W Spruce Ave
- 1568 N Jefferson Place
- 1514 N Monroe St
- 1610 N Monroe St