1555 Perkins Rd Milner, GA 30257
Estimated Value: $766,000 - $1,844,000
--
Bed
5
Baths
4,908
Sq Ft
$261/Sq Ft
Est. Value
About This Home
This home is located at 1555 Perkins Rd, Milner, GA 30257 and is currently estimated at $1,278,781, approximately $260 per square foot. 1555 Perkins Rd is a home located in Pike County with nearby schools including Pike County Primary School, Pike County Elementary School, and Pike County Middle School.
Ownership History
Date
Name
Owned For
Owner Type
Purchase Details
Closed on
Jul 31, 2020
Sold by
Gesham Tony
Bought by
Holbrook Catherine Tucker
Current Estimated Value
Purchase Details
Closed on
Feb 1, 2014
Sold by
Tgresham Enterprises Llc
Bought by
Gresham James A
Purchase Details
Closed on
Apr 9, 2007
Sold by
Gresham Jennifer Ann
Bought by
Gresham James A
Purchase Details
Closed on
Jul 14, 2004
Sold by
Gresham James A and Gresham James V
Bought by
Gresham James A and Gresham Jennifer A
Purchase Details
Closed on
Mar 25, 2002
Sold by
Gresham Jennifer A
Bought by
Gresham James A
Purchase Details
Closed on
Jul 19, 1993
Sold by
Gresham James V and Hinkline Vernon C
Bought by
Gresham James A and Gresham Jennifer A
Purchase Details
Closed on
Aug 9, 1990
Bought by
Gresham James A and Gresham Jennifer A
Create a Home Valuation Report for This Property
The Home Valuation Report is an in-depth analysis detailing your home's value as well as a comparison with similar homes in the area
Home Values in the Area
Average Home Value in this Area
Purchase History
| Date | Buyer | Sale Price | Title Company |
|---|---|---|---|
| Holbrook Catherine Tucker | $1,080,000 | -- | |
| Gresham James A | -- | -- | |
| Gresham James A | -- | -- | |
| Tgresham Enterprises Llc | -- | -- | |
| Gresham James A | -- | -- | |
| Gresham James A | -- | -- | |
| Gresham James A | -- | -- | |
| Gresham James A | -- | -- |
Source: Public Records
Tax History Compared to Growth
Tax History
| Year | Tax Paid | Tax Assessment Tax Assessment Total Assessment is a certain percentage of the fair market value that is determined by local assessors to be the total taxable value of land and additions on the property. | Land | Improvement |
|---|---|---|---|---|
| 2024 | $9,184 | $372,427 | $93,844 | $278,583 |
| 2023 | $10,752 | $372,427 | $93,844 | $278,583 |
| 2022 | $8,652 | $300,067 | $93,844 | $206,223 |
| 2021 | $8,106 | $271,823 | $65,600 | $206,223 |
| 2020 | $7,559 | $250,737 | $65,600 | $185,137 |
| 2019 | $7,583 | $221,522 | $65,600 | $155,922 |
| 2018 | $7,590 | $221,522 | $65,600 | $155,922 |
| 2017 | $7,527 | $221,522 | $65,600 | $155,922 |
| 2016 | $7,417 | $221,522 | $65,600 | $155,922 |
| 2015 | $7,312 | $216,024 | $65,600 | $150,424 |
| 2014 | $4,699 | $152,947 | $65,600 | $87,347 |
| 2013 | -- | $152,946 | $65,600 | $87,346 |
Source: Public Records
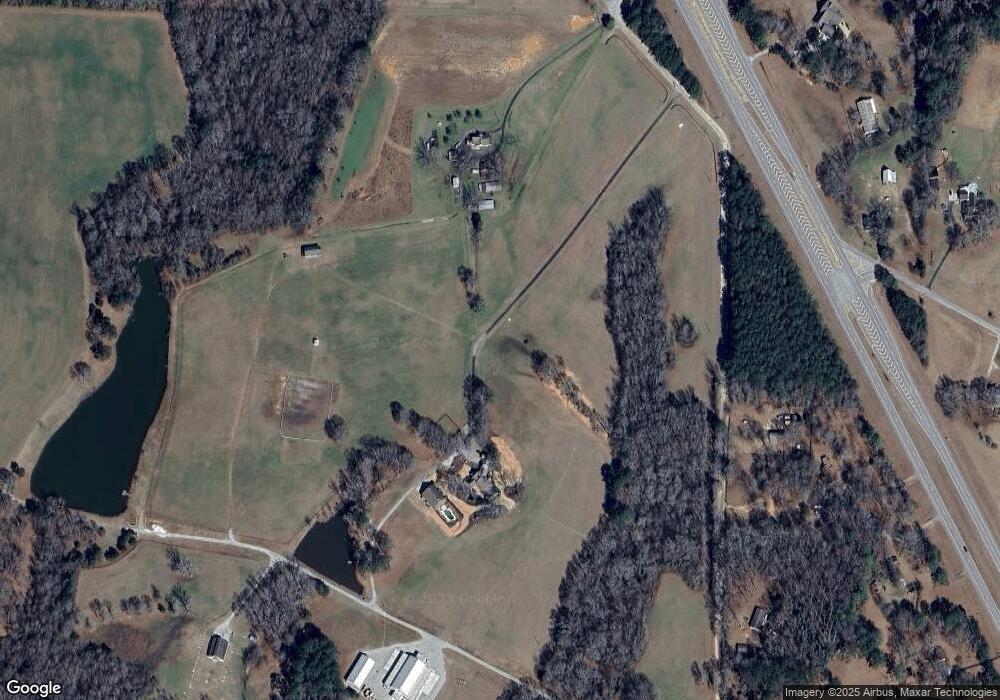
Map
Nearby Homes
- 1605 Shackelford Rd
- 1221 Sells Rd
- 1468 Highway 41 N
- 0 Oak Grove Trial
- 0 Trice Rd Unit 10284703
- 616 Shackelford Rd
- 21 Oak Grove Trail
- 1085 Hemphill Rd
- 420 County Line Rd
- 159 May Ln
- 490 County Line Rd
- 2088 Gresham Rd
- 105 Russell Rd
- 1002 Farmington Rd Unit LOT 30
- 1200 White Oak Way
- 825 County Line Rd
- 1345 Buffington Rd
- 1215 White Oak Way
- 534 Deer Lake Dr
- 215 Brown Springs Rd
- 1555 Perkins Rd Unit 50 +- acres
- 1555 Perkins Rd Unit 277 Ac
- 1561 Kendrick Rd
- 8 ACRES Perkins Rd
- 1344 Perkins Rd
- 63+ AC. Perkins Rd
- 1284 Perkins Rd
- 1615 Perkins Rd
- 891 Highway 41 Unit U
- 861 Highway 41
- 821 Highway 41 Unit U
- 723 U S 41
- 723 Highway 41
- 765 Highway 41 Unit U
- 1166 U S 41
- 1166 Highway 41
- 1166 Highway 41 Unit U
- 977 Perkins Rd
- 0 Sell Rd Unit 9 8406498
- 0 Sell Rd Unit LOT 23 3115301