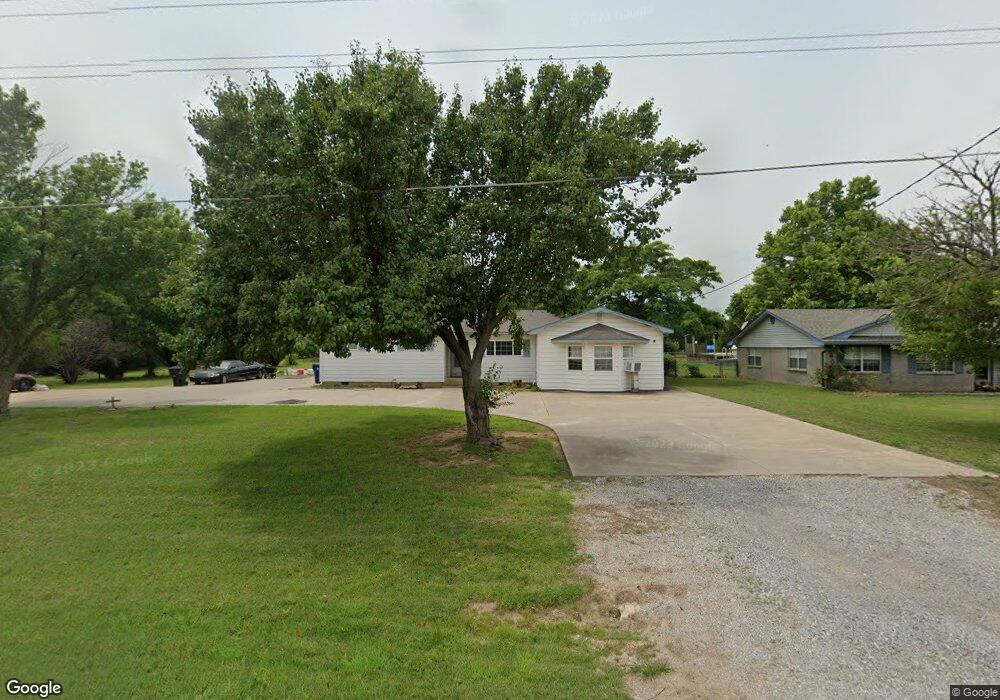
1555 S 42nd St Duncan, OK 73533
Estimated Value: $178,000 - $231,000
3
Beds
2
Baths
2,164
Sq Ft
$93/Sq Ft
Est. Value
About This Home
This home is located at 1555 S 42nd St, Duncan, OK 73533 and is currently estimated at $200,564, approximately $92 per square foot. 1555 S 42nd St is a home located in Stephens County with nearby schools including Empire High School and Republic Academy.
Ownership History
Date
Name
Owned For
Owner Type
Purchase Details
Closed on
Dec 12, 2014
Sold by
Asbcraft Ina
Bought by
Remey C Wilow
Current Estimated Value
Purchase Details
Closed on
Sep 29, 2008
Sold by
Michel Leo F and Michel Cindy
Bought by
Medlin Charles W and Medlin Michelle L
Home Financials for this Owner
Home Financials are based on the most recent Mortgage that was taken out on this home.
Original Mortgage
$127,500
Interest Rate
6.46%
Mortgage Type
Purchase Money Mortgage
Purchase Details
Closed on
Apr 21, 2006
Sold by
Crabtree Haila
Bought by
Michel Leo F
Home Financials for this Owner
Home Financials are based on the most recent Mortgage that was taken out on this home.
Original Mortgage
$79,500
Interest Rate
6.32%
Mortgage Type
Purchase Money Mortgage
Purchase Details
Closed on
May 31, 1996
Sold by
Best Harold E
Purchase Details
Closed on
Jun 3, 1994
Sold by
Brashears Roland
Create a Home Valuation Report for This Property
The Home Valuation Report is an in-depth analysis detailing your home's value as well as a comparison with similar homes in the area
Home Values in the Area
Average Home Value in this Area
Purchase History
| Date | Buyer | Sale Price | Title Company |
|---|---|---|---|
| Remey C Wilow | -- | None Available | |
| Medlin Charles W | $127,500 | None Available | |
| Michel Leo F | $80,000 | None Available | |
| -- | $68,500 | -- | |
| -- | $56,000 | -- |
Source: Public Records
Mortgage History
| Date | Status | Borrower | Loan Amount |
|---|---|---|---|
| Previous Owner | Medlin Charles W | $127,500 | |
| Previous Owner | Michel Leo F | $79,500 |
Source: Public Records
Tax History Compared to Growth
Tax History
| Year | Tax Paid | Tax Assessment Tax Assessment Total Assessment is a certain percentage of the fair market value that is determined by local assessors to be the total taxable value of land and additions on the property. | Land | Improvement |
|---|---|---|---|---|
| 2024 | $1,148 | $12,362 | $466 | $11,896 |
| 2023 | $1,148 | $12,361 | $481 | $11,880 |
| 2022 | $1,065 | $11,772 | $462 | $11,310 |
| 2021 | $1,018 | $10,678 | $393 | $10,285 |
| 2020 | $1,019 | $10,572 | $393 | $10,179 |
| 2019 | $1,036 | $10,506 | $393 | $10,113 |
| 2018 | $1,006 | $10,506 | $393 | $10,113 |
| 2017 | $962 | $10,005 | $393 | $9,612 |
| 2016 | $904 | $9,075 | $393 | $8,682 |
| 2015 | $934 | $9,075 | $393 | $8,682 |
| 2014 | $934 | $11,951 | $660 | $11,291 |
Source: Public Records
Map
Nearby Homes
- 625 Westview Rd
- 1317 S 58th St
- 0000 N 58th St Unit D
- 0002 W Beech Ave Unit C
- 0001 W Beech Ave Unit B
- 0000 W Beech Ave Unit A
- 2086 N 44th St
- 201 201 N 31st St
- 210 210 N 31st St
- 2710 2710 S 27th St
- 106 Emery Rd
- 1244 Dr
- 2110 W Main St
- 1359 Smith Rd
- 1385 Smith Rd
- 209 N 22nd St
- 2108 Ave
- 210 N 22nd St
- 2011 2011 W Oak Ave
- 2006 W Oak Ave
- 1601 S 42nd St
- 1115 S 42nd St
- RT 1 Rr 1
- 1817 N 92nd St
- 1015 S 42nd St
- 1519 S 42nd St
- 1202 S 42nd St
- 925 S 42nd St
- 4400 W Bois d Arc Ave
- 291133 E 1780 Rd
- 4310 W Bois d Arc Ave
- 4314 W Bois d Arc Ave
- 1515 S 42nd St
- 4440 W Bois d Arc Ave
- 177 S 42nd St
- 177 S 42nd St
- 4315 W Bois d Arc Ave
- 4319 4319 W Bois D'Arc
- 1615 S 42nd St
- 1520 S 42nd St