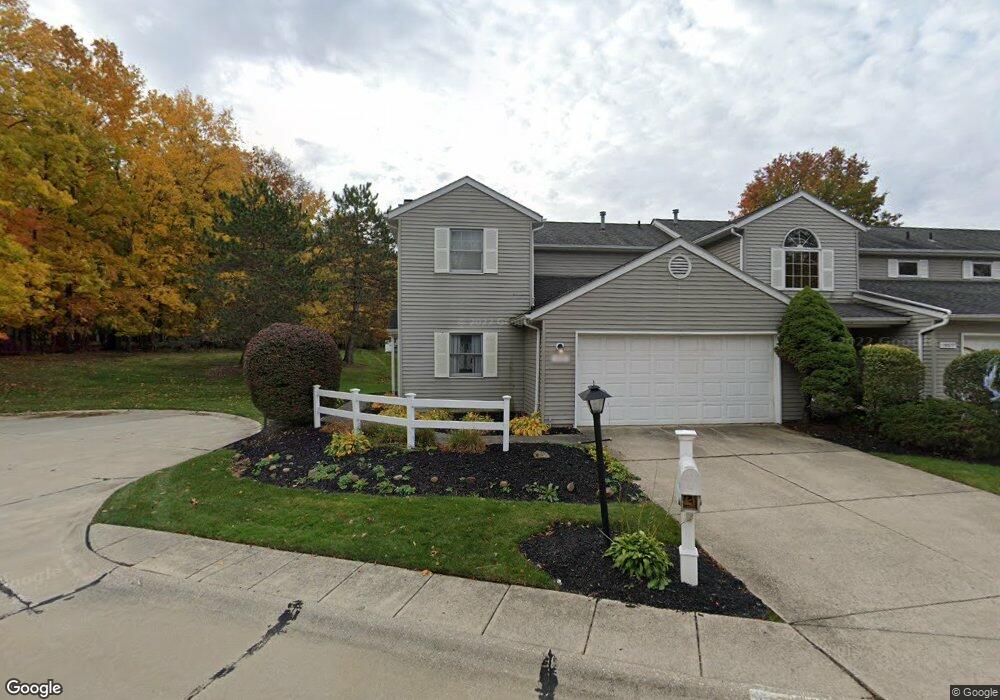
15555 Grosse Pointe Oval Strongsville, OH 44136
Estimated Value: $252,000 - $265,000
2
Beds
2
Baths
1,566
Sq Ft
$164/Sq Ft
Est. Value
About This Home
This home is located at 15555 Grosse Pointe Oval, Strongsville, OH 44136 and is currently estimated at $257,065, approximately $164 per square foot. 15555 Grosse Pointe Oval is a home located in Cuyahoga County with nearby schools including Strongsville High School, The Academy of St. Bartholomew, and Sts Joseph & John Interparochial School.
Ownership History
Date
Name
Owned For
Owner Type
Purchase Details
Closed on
Jun 23, 2004
Sold by
Urban David
Bought by
Smith Kathleen M and Cigic Joseph
Current Estimated Value
Home Financials for this Owner
Home Financials are based on the most recent Mortgage that was taken out on this home.
Original Mortgage
$105,600
Outstanding Balance
$48,552
Interest Rate
5.12%
Mortgage Type
Purchase Money Mortgage
Estimated Equity
$208,513
Purchase Details
Closed on
Nov 3, 1998
Sold by
Paliga Laura I and Paliga John D
Bought by
Urban David J
Home Financials for this Owner
Home Financials are based on the most recent Mortgage that was taken out on this home.
Original Mortgage
$118,200
Interest Rate
6.59%
Purchase Details
Closed on
Jun 15, 1989
Sold by
Koch Robert C
Bought by
Reagan Laura I
Purchase Details
Closed on
Jan 1, 1988
Bought by
Koch Robert C
Create a Home Valuation Report for This Property
The Home Valuation Report is an in-depth analysis detailing your home's value as well as a comparison with similar homes in the area
Home Values in the Area
Average Home Value in this Area
Purchase History
| Date | Buyer | Sale Price | Title Company |
|---|---|---|---|
| Smith Kathleen M | $132,000 | Lawyers Title | |
| Urban David J | $124,500 | Lorain County Title Co Inc | |
| Reagan Laura I | $103,500 | -- | |
| Koch Robert C | -- | -- |
Source: Public Records
Mortgage History
| Date | Status | Borrower | Loan Amount |
|---|---|---|---|
| Open | Smith Kathleen M | $105,600 | |
| Closed | Urban David J | $118,200 |
Source: Public Records
Tax History Compared to Growth
Tax History
| Year | Tax Paid | Tax Assessment Tax Assessment Total Assessment is a certain percentage of the fair market value that is determined by local assessors to be the total taxable value of land and additions on the property. | Land | Improvement |
|---|---|---|---|---|
| 2024 | $3,599 | $76,650 | $12,285 | $64,365 |
| 2023 | $3,533 | $56,420 | $11,200 | $45,220 |
| 2022 | $3,507 | $56,420 | $11,200 | $45,220 |
| 2021 | $3,479 | $56,420 | $11,200 | $45,220 |
| 2020 | $3,306 | $47,430 | $9,420 | $38,010 |
| 2019 | $3,209 | $135,500 | $26,900 | $108,600 |
| 2018 | $2,913 | $47,430 | $9,420 | $38,010 |
| 2017 | $2,914 | $43,930 | $7,180 | $36,750 |
| 2016 | $2,891 | $43,930 | $7,180 | $36,750 |
| 2015 | $2,992 | $43,930 | $7,180 | $36,750 |
| 2014 | $2,992 | $44,840 | $7,320 | $37,520 |
Source: Public Records
Map
Nearby Homes
- 15485 Albion Rd
- 9945 Twelve Oaks Cir
- 10010 Chevy Chase
- 9890 Webster Rd
- 10369 Council Bluff
- 0 Webster Rd
- 16519 Albion Rd
- 9129 Tahoe Cir
- 14069 Basswood Cir
- 9531 Nicole Cir
- 14584 Baywood Ln
- 14557 Baywood Ln
- 14644 Baywood Ln
- Buchanan Plan at The Enclave at Pine Lakes Crossing
- Belleville Plan at The Enclave at Pine Lakes Crossing
- 14298 Calderdale Ln
- 14236 Calderdale Ln
- 12199 Webster Rd
- 13402 Bridgecreek Cir
- 12101 The Bluffs
- 15577 Grosse Pointe Oval
- 15599 Grosse Pointe Oval
- 10381 Leawood Oval
- 15534 Grosse Pointe Oval
- 15546 Grosse Pointe Oval
- 15558 Grosse Pointe Oval
- 15600 Grosse Pointe Oval
- 10393 Leawood Oval
- 15642 Grosse Pointe Oval
- 15654 Grosse Pointe Oval
- 15661 Grosse Pointe Oval
- 10435 Leawood Oval
- 10400 Leawood Oval
- 15696 Grosse Pointe Oval
- 10412 Leawood Oval
- 15683 Grosse Pointe Oval
- 10454 Leawood Oval
- 10447 Leawood Oval
- 15708 Grosse Pointe Oval
- 15705 Grosse Pointe Oval