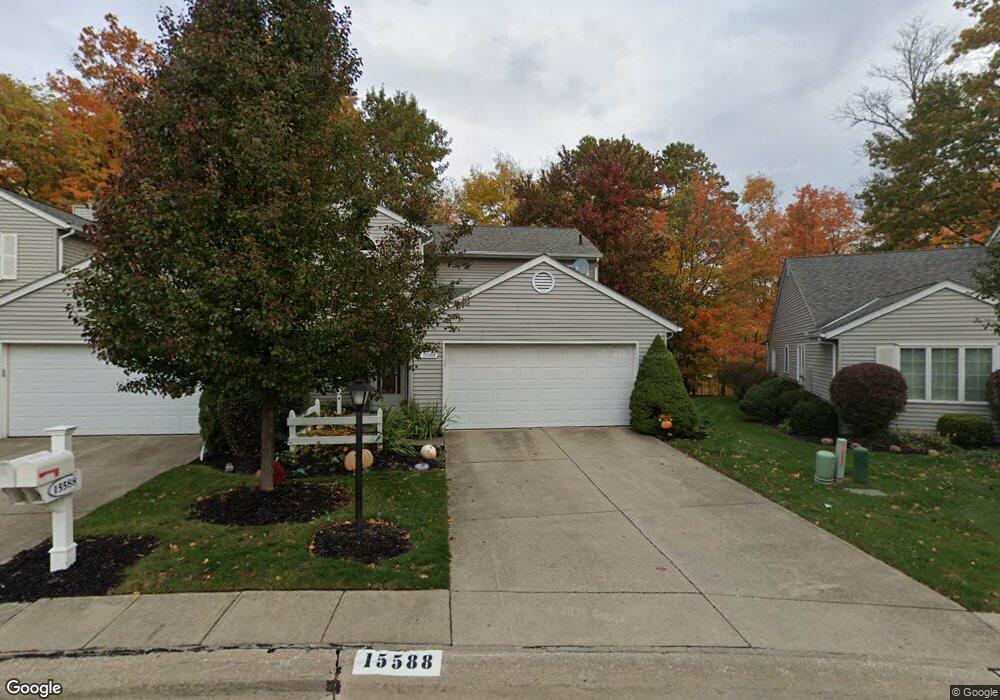
15558 Grosse Pointe Oval Strongsville, OH 44136
Estimated Value: $235,000 - $266,000
2
Beds
2
Baths
1,442
Sq Ft
$174/Sq Ft
Est. Value
About This Home
This home is located at 15558 Grosse Pointe Oval, Strongsville, OH 44136 and is currently estimated at $250,792, approximately $173 per square foot. 15558 Grosse Pointe Oval is a home located in Cuyahoga County with nearby schools including Strongsville High School, Sts Joseph & John Interparochial School, and Royal Redeemer Lutheran School.
Ownership History
Date
Name
Owned For
Owner Type
Purchase Details
Closed on
Jul 29, 2005
Sold by
Drol William A and Wright Karen L
Bought by
Favazza Jennifer M
Current Estimated Value
Home Financials for this Owner
Home Financials are based on the most recent Mortgage that was taken out on this home.
Original Mortgage
$146,697
Outstanding Balance
$77,458
Interest Rate
5.74%
Mortgage Type
Purchase Money Mortgage
Estimated Equity
$173,334
Purchase Details
Closed on
May 24, 1996
Sold by
Sado David R
Bought by
Drol William A and Drol Norbert J
Home Financials for this Owner
Home Financials are based on the most recent Mortgage that was taken out on this home.
Original Mortgage
$76,500
Interest Rate
7%
Mortgage Type
New Conventional
Purchase Details
Closed on
Jan 1, 1988
Bought by
Lesniak Christine M
Create a Home Valuation Report for This Property
The Home Valuation Report is an in-depth analysis detailing your home's value as well as a comparison with similar homes in the area
Home Values in the Area
Average Home Value in this Area
Purchase History
| Date | Buyer | Sale Price | Title Company |
|---|---|---|---|
| Favazza Jennifer M | $149,000 | Maximum | |
| Drol William A | $121,500 | -- | |
| Lesniak Christine M | -- | -- |
Source: Public Records
Mortgage History
| Date | Status | Borrower | Loan Amount |
|---|---|---|---|
| Open | Favazza Jennifer M | $146,697 | |
| Previous Owner | Drol William A | $76,500 |
Source: Public Records
Tax History Compared to Growth
Tax History
| Year | Tax Paid | Tax Assessment Tax Assessment Total Assessment is a certain percentage of the fair market value that is determined by local assessors to be the total taxable value of land and additions on the property. | Land | Improvement |
|---|---|---|---|---|
| 2024 | $3,653 | $77,805 | $12,950 | $64,855 |
| 2023 | $3,562 | $56,880 | $11,870 | $45,010 |
| 2022 | $3,536 | $56,880 | $11,870 | $45,010 |
| 2021 | $3,508 | $56,880 | $11,870 | $45,010 |
| 2020 | $3,334 | $47,810 | $9,980 | $37,840 |
| 2019 | $3,236 | $136,600 | $28,500 | $108,100 |
| 2018 | $2,937 | $47,810 | $9,980 | $37,840 |
| 2017 | $2,939 | $44,310 | $7,630 | $36,680 |
| 2016 | $2,916 | $44,310 | $7,630 | $36,680 |
| 2015 | $3,018 | $44,310 | $7,630 | $36,680 |
| 2014 | $3,018 | $45,220 | $7,770 | $37,450 |
Source: Public Records
Map
Nearby Homes
- 10010 Chevy Chase
- 9890 Webster Rd
- 15485 Albion Rd
- 9945 Twelve Oaks Cir
- 0 Webster Rd
- 10369 Council Bluff
- 9129 Tahoe Cir
- 16519 Albion Rd
- 9531 Nicole Cir
- 14069 Basswood Cir
- 14584 Baywood Ln
- 14557 Baywood Ln
- 14644 Baywood Ln
- Buchanan Plan at The Enclave at Pine Lakes Crossing
- Belleville Plan at The Enclave at Pine Lakes Crossing
- 14298 Calderdale Ln
- 14236 Calderdale Ln
- 13402 Bridgecreek Cir
- 12199 Webster Rd
- 12101 The Bluffs
- 15600 Grosse Pointe Oval
- 15546 Grosse Pointe Oval
- 15642 Grosse Pointe Oval
- 15534 Grosse Pointe Oval
- 15577 Grosse Pointe Oval
- 15654 Grosse Pointe Oval
- 15555 Grosse Pointe Oval
- 15599 Grosse Pointe Oval
- 9758 Brookline Oval
- 9790 Brookline Oval
- 15696 Grosse Pointe Oval
- 9812 Brookline Oval
- 10381 Leawood Oval
- 9692 Brookline Oval
- 15708 Grosse Pointe Oval
- 15661 Grosse Pointe Oval
- 15683 Grosse Pointe Oval
- 10393 Leawood Oval
- 15750 Grosse Pointe Oval
- 10400 Leawood Oval