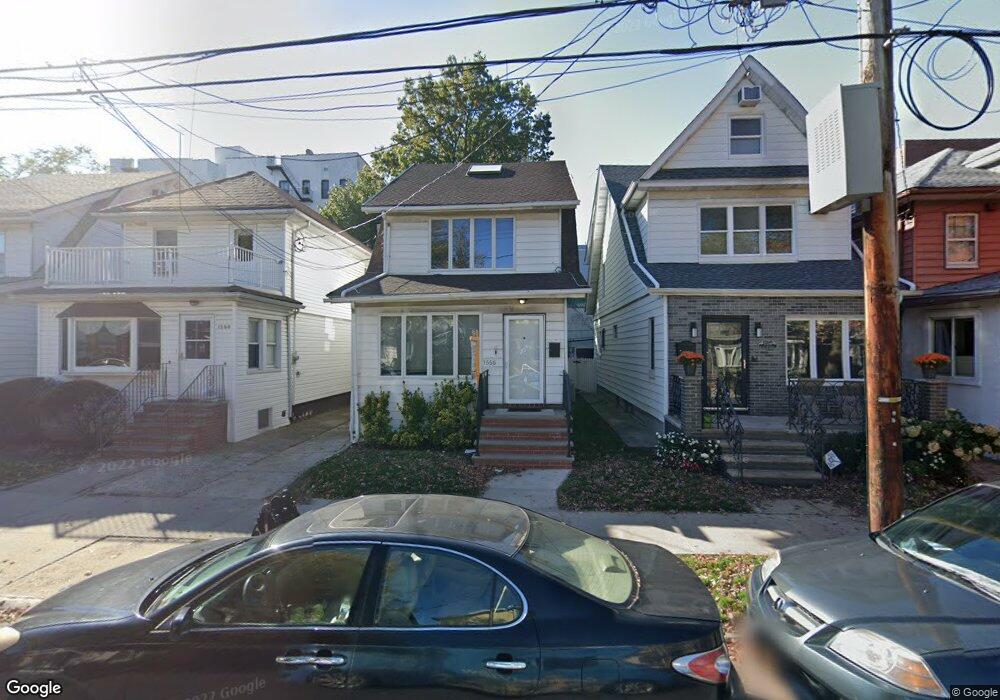
1556 E 21st St Brooklyn, NY 11210
Midwood NeighborhoodEstimated Value: $1,156,793 - $1,437,000
--
Bed
--
Bath
1,496
Sq Ft
$879/Sq Ft
Est. Value
About This Home
This home is located at 1556 E 21st St, Brooklyn, NY 11210 and is currently estimated at $1,315,198, approximately $879 per square foot. 1556 E 21st St is a home located in Kings County with nearby schools including P.S. 197 Kings Highway Academy (The), Andries Hudde School, and Urban Dove Team Charter School.
Ownership History
Date
Name
Owned For
Owner Type
Purchase Details
Closed on
Jul 14, 2024
Sold by
Glaser Evelyn and Glaser Joseph E
Bought by
The Joseph Glaser Irrevocable Trust
Current Estimated Value
Purchase Details
Closed on
Mar 8, 2013
Sold by
Salame Susan and Salame Theodore
Bought by
Glaser Evelyn and Glaser Joseph E
Home Financials for this Owner
Home Financials are based on the most recent Mortgage that was taken out on this home.
Original Mortgage
$709,904
Interest Rate
3.57%
Mortgage Type
Purchase Money Mortgage
Purchase Details
Closed on
Jul 19, 2004
Sold by
Harbon Liliane and Harbon Marcel
Bought by
Salame Susan and Salame Theodore
Purchase Details
Closed on
Jun 29, 1994
Sold by
Harary Joseph M and Harary Rebecca
Bought by
Harbon Liliane and Harbon Marcel
Home Financials for this Owner
Home Financials are based on the most recent Mortgage that was taken out on this home.
Original Mortgage
$0
Interest Rate
8.46%
Create a Home Valuation Report for This Property
The Home Valuation Report is an in-depth analysis detailing your home's value as well as a comparison with similar homes in the area
Home Values in the Area
Average Home Value in this Area
Purchase History
| Date | Buyer | Sale Price | Title Company |
|---|---|---|---|
| The Joseph Glaser Irrevocable Trust | -- | -- | |
| Glaser Evelyn | $723,000 | -- | |
| Glaser Evelyn | $723,000 | -- | |
| Salame Susan | -- | -- | |
| Salame Susan | -- | -- | |
| Harbon Liliane | -- | -- | |
| Harbon Liliane | -- | -- |
Source: Public Records
Mortgage History
| Date | Status | Borrower | Loan Amount |
|---|---|---|---|
| Previous Owner | Glaser Evelyn | $709,904 | |
| Previous Owner | Harbon Liliane | $0 | |
| Closed | Salame Susan | $0 |
Source: Public Records
Tax History Compared to Growth
Tax History
| Year | Tax Paid | Tax Assessment Tax Assessment Total Assessment is a certain percentage of the fair market value that is determined by local assessors to be the total taxable value of land and additions on the property. | Land | Improvement |
|---|---|---|---|---|
| 2025 | $9,307 | $66,540 | $18,240 | $48,300 |
| 2024 | $9,307 | $71,700 | $18,240 | $53,460 |
| 2023 | $9,340 | $75,060 | $18,240 | $56,820 |
| 2022 | $8,661 | $65,820 | $18,240 | $47,580 |
| 2021 | $8,614 | $60,300 | $18,240 | $42,060 |
| 2020 | $4,040 | $48,660 | $18,240 | $30,420 |
| 2019 | $8,078 | $48,660 | $18,240 | $30,420 |
| 2018 | $7,812 | $38,324 | $12,974 | $25,350 |
| 2017 | $7,370 | $36,156 | $12,619 | $23,537 |
| 2016 | $6,819 | $34,110 | $13,093 | $21,017 |
| 2015 | $4,114 | $32,180 | $12,796 | $19,384 |
| 2014 | $4,114 | $32,180 | $14,758 | $17,422 |
Source: Public Records
Map
Nearby Homes
- 1922 Ocean Ave
- 1530 E 22nd St
- 1542 E 22nd St
- 1503 E 22nd St
- 2114 Avenue N
- 2234 Olean St
- 1820 Avenue N Unit 5G
- 1801 Avenue N Unit 6C
- 1586 E 22nd St Unit 6
- 2025 Ocean Ave Unit 4 A
- 1717 Avenue N Unit 3C
- 1717 Ave N Unit 2 N
- 1392 E 18th St
- 3566 Bedford Ave
- 1560 E 18th St Unit 6A
- 1560 E 18 St
- 1560 E 18th St Unit 3H
- 1560 E 18th St Unit 3D
- 2404 Avenue O
- 1689 E 21st St Unit 5
- 1556 E 21 St
- 1554 E 21st St
- 1560 E 21st St
- 1552 E 21st St
- 1564 E 21st St
- 1550 E 21st St
- 1566 E 21st St
- 1548 E 21st St
- 1568 E 21st St
- 1570 E 21st St
- 1921 Ocean Ave Unit 8
- 1921 Ocean Ave Unit 7
- 1921 Ocean Ave Unit 6
- 1921 Ocean Ave Unit 5
- 1921 Ocean Ave Unit 4
- 1921 Ocean Ave Unit 3
- 1921 Ocean Ave
- 1544 E 21st St
- 1923 Ocean Ave
- 1572 E 21st St