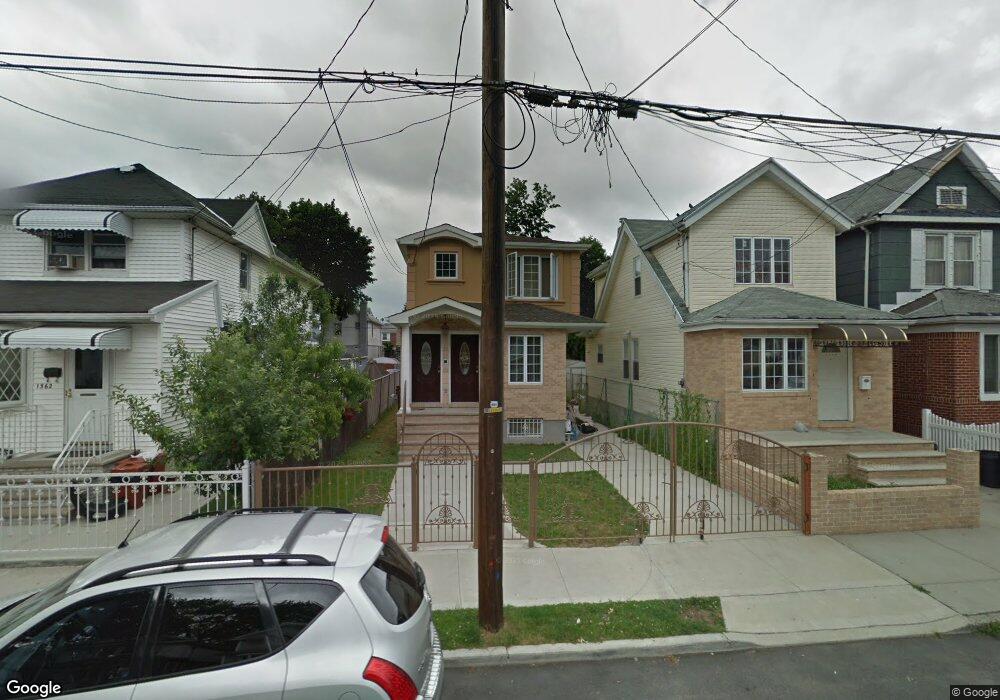
1556 E 49th St Brooklyn, NY 11234
Flatlands NeighborhoodEstimated Value: $911,000 - $1,385,000
Studio
--
Bath
2,160
Sq Ft
$507/Sq Ft
Est. Value
About This Home
This home is located at 1556 E 49th St, Brooklyn, NY 11234 and is currently estimated at $1,094,286, approximately $506 per square foot. 1556 E 49th St is a home located in Kings County with nearby schools including P.S. 203 Floyd Bennett, Midwood Catholic Academy, and Mesivta Tiferes Yisroel.
Ownership History
Date
Name
Owned For
Owner Type
Purchase Details
Closed on
Mar 30, 2010
Sold by
1556 East 49Th Street Inc
Bought by
Neau Kettly and Seus Jean F
Current Estimated Value
Home Financials for this Owner
Home Financials are based on the most recent Mortgage that was taken out on this home.
Original Mortgage
$584,556
Outstanding Balance
$389,913
Interest Rate
5.03%
Mortgage Type
Purchase Money Mortgage
Estimated Equity
$704,373
Create a Home Valuation Report for This Property
The Home Valuation Report is an in-depth analysis detailing your home's value as well as a comparison with similar homes in the area
Home Values in the Area
Average Home Value in this Area
Purchase History
| Date | Buyer | Sale Price | Title Company |
|---|---|---|---|
| Neau Kettly | $595,340 | -- |
Source: Public Records
Mortgage History
| Date | Status | Borrower | Loan Amount |
|---|---|---|---|
| Open | Neau Kettly | $584,556 |
Source: Public Records
Tax History
| Year | Tax Paid | Tax Assessment Tax Assessment Total Assessment is a certain percentage of the fair market value that is determined by local assessors to be the total taxable value of land and additions on the property. | Land | Improvement |
|---|---|---|---|---|
| 2025 | $9,559 | $59,520 | $11,340 | $48,180 |
| 2024 | $9,559 | $66,240 | $11,340 | $54,900 |
| 2023 | $9,598 | $66,540 | $11,340 | $55,200 |
| 2022 | $8,900 | $54,480 | $11,340 | $43,140 |
| 2021 | $8,852 | $42,060 | $11,340 | $30,720 |
| 2020 | $4,375 | $41,820 | $11,340 | $30,480 |
| 2019 | $8,297 | $39,660 | $11,340 | $28,320 |
| 2018 | $8,246 | $40,449 | $11,095 | $29,354 |
| 2017 | $7,779 | $38,160 | $10,392 | $27,768 |
| 2016 | $7,197 | $36,000 | $11,340 | $24,660 |
| 2015 | $4,715 | $39,096 | $11,629 | $27,467 |
| 2014 | $4,715 | $38,802 | $11,542 | $27,260 |
Source: Public Records
Map
Nearby Homes
- 1566 E 49th St
- 2037 Schenectady Ave
- 4809 Avenue M
- 1563 E 46th St
- 1530 E 51st St
- 5001 Avenue M
- 1568 E 46th St
- 4916 Avenue M
- 1500 E 51st St
- 1573 E 45th St
- 1511 E 51st St
- 2117 Troy Ave
- 1434 E 52nd St
- 1615 E 51st St
- 4409 Avenue M
- 2143 Schenectady Ave
- 1492 E 45th St
- 1454 E 53rd St
- 1448 E 53rd St
- 1646 E 51st St
Your Personal Tour Guide
Ask me questions while you tour the home.