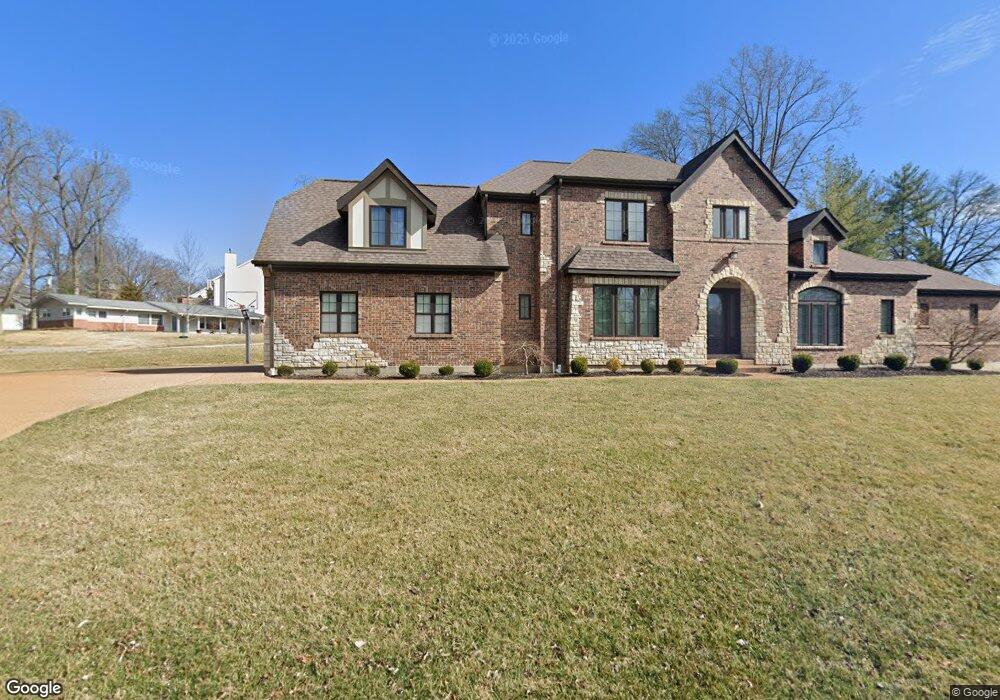
1556 Fawnvalley Dr Saint Louis, MO 63131
Estimated Value: $1,374,013 - $1,976,000
4
Beds
4
Baths
3,967
Sq Ft
$403/Sq Ft
Est. Value
About This Home
This home is located at 1556 Fawnvalley Dr, Saint Louis, MO 63131 and is currently estimated at $1,599,253, approximately $403 per square foot. 1556 Fawnvalley Dr is a home located in St. Louis County with nearby schools including Westchester Elementary School, North Kirkwood Middle School, and Kirkwood Senior High School.
Ownership History
Date
Name
Owned For
Owner Type
Purchase Details
Closed on
Jun 21, 2013
Sold by
Krechely Israel and Krechely Gurevich Natalie
Bought by
Wang Dawei and Cai Jian
Current Estimated Value
Home Financials for this Owner
Home Financials are based on the most recent Mortgage that was taken out on this home.
Original Mortgage
$68,000
Outstanding Balance
$15,306
Interest Rate
3.54%
Mortgage Type
New Conventional
Estimated Equity
$1,583,947
Purchase Details
Closed on
Jan 28, 2011
Sold by
Nienhaus Brian K and Kreienkamp Raymond S
Bought by
Krechely Israel and Krechely Gurevich Natalie
Home Financials for this Owner
Home Financials are based on the most recent Mortgage that was taken out on this home.
Original Mortgage
$115,500
Interest Rate
4.75%
Mortgage Type
New Conventional
Purchase Details
Closed on
Jan 29, 1997
Sold by
Tucker Joe D and Tucker Peggy E
Bought by
Tucker Joe D and Tucker Peggy E
Create a Home Valuation Report for This Property
The Home Valuation Report is an in-depth analysis detailing your home's value as well as a comparison with similar homes in the area
Home Values in the Area
Average Home Value in this Area
Purchase History
| Date | Buyer | Sale Price | Title Company |
|---|---|---|---|
| Wang Dawei | $850,000 | Investors Title Co Clayton | |
| Krechely Israel | $165,000 | Ust | |
| Tucker Joe D | -- | None Available |
Source: Public Records
Mortgage History
| Date | Status | Borrower | Loan Amount |
|---|---|---|---|
| Open | Wang Dawei | $68,000 | |
| Previous Owner | Krechely Israel | $115,500 |
Source: Public Records
Tax History Compared to Growth
Tax History
| Year | Tax Paid | Tax Assessment Tax Assessment Total Assessment is a certain percentage of the fair market value that is determined by local assessors to be the total taxable value of land and additions on the property. | Land | Improvement |
|---|---|---|---|---|
| 2025 | $11,855 | $235,220 | $73,260 | $161,960 |
| 2024 | $11,855 | $205,370 | $57,740 | $147,630 |
| 2023 | $11,855 | $205,370 | $57,740 | $147,630 |
| 2022 | $10,823 | $177,500 | $57,740 | $119,760 |
| 2021 | $10,706 | $177,500 | $57,740 | $119,760 |
| 2020 | $10,521 | $167,700 | $53,300 | $114,400 |
| 2019 | $10,534 | $167,700 | $53,300 | $114,400 |
| 2018 | $11,585 | $165,530 | $27,720 | $137,810 |
| 2017 | $11,616 | $165,530 | $27,720 | $137,810 |
| 2016 | $11,036 | $159,280 | $23,920 | $135,360 |
| 2015 | $9,761 | $140,660 | $23,920 | $116,740 |
| 2014 | $9,864 | $138,930 | $11,910 | $127,020 |
Source: Public Records
Map
Nearby Homes
- 8 Briarbrook Trail
- 723 Oak Valley Dr
- 1728 Folkstone Dr
- 1741 Pine Hill Dr
- 1345 Woodgate Dr
- 1126 Bopp Rd
- 811 Cherry St
- 1090 Kinstern Dr
- 1029 Kinstern Dr
- 11358 Manchester Rd
- 11909 Lillian Ave
- 11913 Lillian Ave
- The Hawthorne Plan at Ballas Ridge
- The Roclare II Plan at Ballas Ridge
- The Westchester IV Plan at Ballas Ridge
- The Nottingham II Plan at Ballas Ridge
- The Hawthorne II Plan at Ballas Ridge
- 12439 Springdale Ln Unit TBB
- TBB
- TBB Ballas Ridge Roclare II
- 11734 Claychester Dr
- 11728 Claychester Dr
- 1550 Fawnvalley Dr
- 11737 Claychester Dr
- 1567 Fawnvalley Dr
- 11723 Claychester Dr
- 1559 Fawnvalley Dr
- 11800 Claychester Dr
- 11722 Claychester Dr
- 1551 Fawnvalley Dr
- 11757 Serama Dr
- 11750 Fawnridge Dr
- 11717 Claychester Dr
- 11747 Serama Dr
- 1543 Fawnvalley Dr
- 11714 Claychester Dr
- 11742 Fawnridge Dr
- 1550 Windridge Dr
- 1544 Windridge Dr
- 11801 Claychester Dr