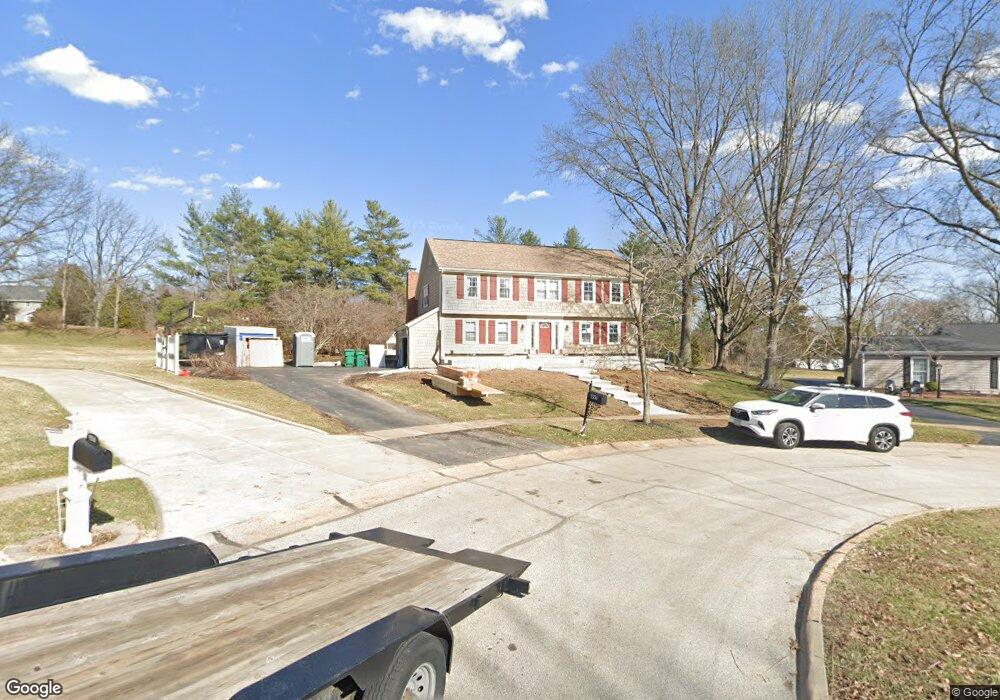
1556 Foxleigh Ct Saint Louis, MO 63131
Estimated Value: $898,489 - $1,093,000
4
Beds
4
Baths
3,189
Sq Ft
$313/Sq Ft
Est. Value
About This Home
This home is located at 1556 Foxleigh Ct, Saint Louis, MO 63131 and is currently estimated at $997,372, approximately $312 per square foot. 1556 Foxleigh Ct is a home located in St. Louis County with nearby schools including Mason Ridge Elementary School, Parkway West Middle School, and Parkway West High School.
Ownership History
Date
Name
Owned For
Owner Type
Purchase Details
Closed on
Dec 31, 2012
Sold by
Stanec Vincent F and Stanec Marjorie A
Bought by
Stanec James Robert and Stanec Amanda Dawn
Current Estimated Value
Home Financials for this Owner
Home Financials are based on the most recent Mortgage that was taken out on this home.
Original Mortgage
$301,000
Outstanding Balance
$209,286
Interest Rate
3.37%
Mortgage Type
Seller Take Back
Estimated Equity
$788,086
Purchase Details
Closed on
Jan 31, 2012
Sold by
Keyes Geoffrey J and Keyes Carol A
Bought by
Stanec Vincent F and Stanec Marjorie A
Purchase Details
Closed on
May 28, 1998
Sold by
Bennett Richard T and Bennett Diane G
Bought by
Keyes Geoffrey J and Keyes Carol A
Home Financials for this Owner
Home Financials are based on the most recent Mortgage that was taken out on this home.
Original Mortgage
$270,000
Interest Rate
7.2%
Create a Home Valuation Report for This Property
The Home Valuation Report is an in-depth analysis detailing your home's value as well as a comparison with similar homes in the area
Home Values in the Area
Average Home Value in this Area
Purchase History
| Date | Buyer | Sale Price | Title Company |
|---|---|---|---|
| Stanec James Robert | -- | None Available | |
| Stanec Vincent F | $407,500 | Us Title Main | |
| Keyes Geoffrey J | -- | -- |
Source: Public Records
Mortgage History
| Date | Status | Borrower | Loan Amount |
|---|---|---|---|
| Open | Stanec James Robert | $301,000 | |
| Previous Owner | Keyes Geoffrey J | $270,000 |
Source: Public Records
Tax History Compared to Growth
Tax History
| Year | Tax Paid | Tax Assessment Tax Assessment Total Assessment is a certain percentage of the fair market value that is determined by local assessors to be the total taxable value of land and additions on the property. | Land | Improvement |
|---|---|---|---|---|
| 2025 | $7,162 | $172,020 | $69,100 | $102,920 |
| 2024 | $7,162 | $123,120 | $61,430 | $61,690 |
| 2023 | $6,778 | $123,120 | $61,430 | $61,690 |
| 2022 | $7,459 | $123,120 | $69,100 | $54,020 |
| 2021 | $7,397 | $130,050 | $69,100 | $60,950 |
| 2020 | $7,568 | $120,440 | $69,100 | $51,340 |
| 2019 | $6,264 | $101,120 | $69,100 | $32,020 |
| 2018 | $6,209 | $92,650 | $61,430 | $31,220 |
| 2017 | $6,125 | $92,650 | $61,430 | $31,220 |
| 2016 | $5,922 | $85,160 | $53,710 | $31,450 |
| 2015 | $6,242 | $85,160 | $53,710 | $31,450 |
| 2014 | $5,330 | $78,990 | $22,650 | $56,340 |
Source: Public Records
Map
Nearby Homes
- 1473 Mason Valley Rd
- 1536 S Mason Rd
- 1359 S Mason Rd
- 1652 Mason Knoll Rd
- 13527 Royal Glen Dr
- 13354 Thornhill Dr
- 29a Chapel Hill Estates Dr
- 1826 S Mason Rd
- 1106 Wheaton Hill Ct
- 1515 Topping Rd
- 900 Weidman Rd
- 1824 Topping Rd
- 1369 Nykiel Ct
- 11 Roclare Ln
- 1115 Dutch Mill Dr
- 1004 Weidman Rd
- 11 Summerhill Ln
- 933 Baintree Ln
- 939 Wynhaven Ln
- 12841 Thornhill Ct
- 1550 Foxleigh Ct
- 1562 Foxleigh Ct
- 1543 Mason Valley Rd
- 1551 Mason Valley Rd
- 1535 Mason Valley Rd
- 1570 Foxleigh Ct
- 1559 Mason Valley Rd
- 1527 Mason Valley Rd
- 1555 Foxleigh Ct
- 1511 Mason Hill Ct
- 1563 Foxleigh Ct
- 1542 Mason Valley Rd
- 1567 Mason Valley Rd
- 1577 Foxleigh Ct
- 1519 Mason Hill Ct
- 1534 Mason Valley Rd
- 1550 Mason Valley Rd
- 1584 Foxleigh Ct
- 13477 Featherstone Dr
- 1558 Mason Valley Rd