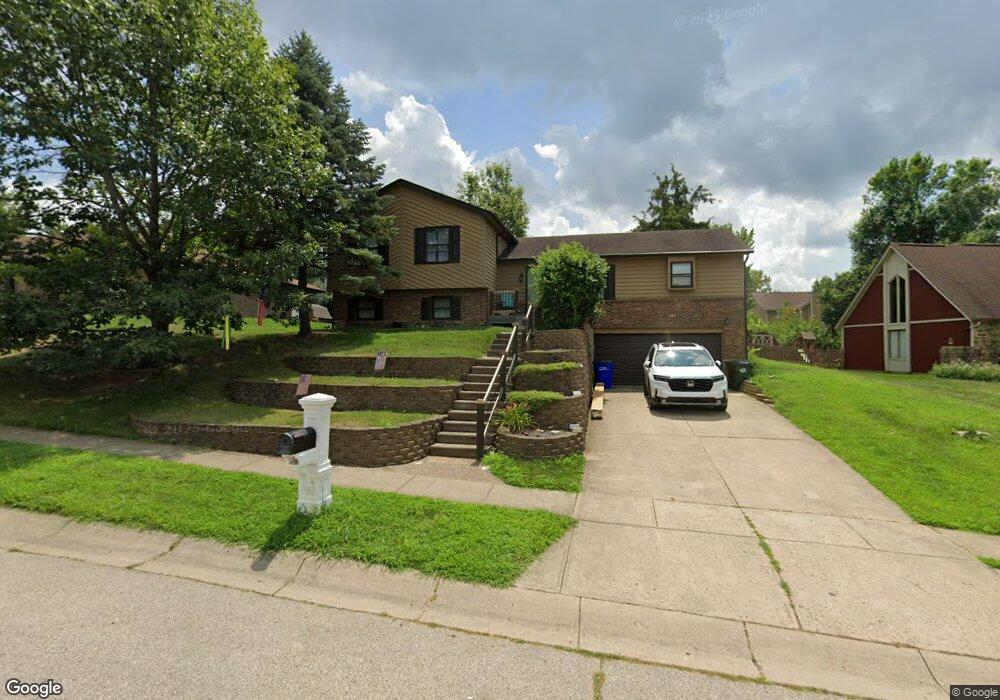
1556 Hickory Glenn Dr Miamisburg, OH 45342
Estimated Value: $277,512 - $300,000
3
Beds
2
Baths
1,679
Sq Ft
$173/Sq Ft
Est. Value
About This Home
This home is located at 1556 Hickory Glenn Dr, Miamisburg, OH 45342 and is currently estimated at $289,878, approximately $172 per square foot. 1556 Hickory Glenn Dr is a home located in Montgomery County with nearby schools including Miamisburg High School and Bethel Baptist School.
Ownership History
Date
Name
Owned For
Owner Type
Purchase Details
Closed on
Jul 25, 2024
Sold by
Nelson Ray Lee and Courtney Elizabeth
Bought by
Linx Living Trust and Nelson
Current Estimated Value
Purchase Details
Closed on
Oct 5, 2020
Sold by
Nelson Ray L and Strassburger Courtney
Bought by
Nelson Ray L and Nelson Courtney
Home Financials for this Owner
Home Financials are based on the most recent Mortgage that was taken out on this home.
Original Mortgage
$172,000
Interest Rate
2.8%
Mortgage Type
New Conventional
Purchase Details
Closed on
Aug 27, 2018
Sold by
Hoyle Robert C
Bought by
Nelson Ray L and Strassburger Courtney
Home Financials for this Owner
Home Financials are based on the most recent Mortgage that was taken out on this home.
Original Mortgage
$171,830
Interest Rate
4.87%
Mortgage Type
FHA
Create a Home Valuation Report for This Property
The Home Valuation Report is an in-depth analysis detailing your home's value as well as a comparison with similar homes in the area
Home Values in the Area
Average Home Value in this Area
Purchase History
| Date | Buyer | Sale Price | Title Company |
|---|---|---|---|
| Linx Living Trust | -- | None Listed On Document | |
| Nelson Ray L | -- | Prodigy Title Agency | |
| Nelson Ray L | $175,000 | None Available |
Source: Public Records
Mortgage History
| Date | Status | Borrower | Loan Amount |
|---|---|---|---|
| Previous Owner | Nelson Ray L | $172,000 | |
| Previous Owner | Nelson Ray L | $171,830 |
Source: Public Records
Tax History Compared to Growth
Tax History
| Year | Tax Paid | Tax Assessment Tax Assessment Total Assessment is a certain percentage of the fair market value that is determined by local assessors to be the total taxable value of land and additions on the property. | Land | Improvement |
|---|---|---|---|---|
| 2024 | $4,484 | $70,640 | $14,490 | $56,150 |
| 2023 | $4,484 | $70,640 | $14,490 | $56,150 |
| 2022 | $4,434 | $58,880 | $12,080 | $46,800 |
| 2021 | $3,922 | $58,880 | $12,080 | $46,800 |
| 2020 | $4,015 | $58,880 | $12,080 | $46,800 |
| 2019 | $3,526 | $48,660 | $10,500 | $38,160 |
| 2018 | $3,538 | $48,660 | $10,500 | $38,160 |
| 2017 | $3,514 | $48,660 | $10,500 | $38,160 |
| 2016 | $3,242 | $43,260 | $10,500 | $32,760 |
| 2015 | $3,178 | $43,260 | $10,500 | $32,760 |
| 2014 | $3,178 | $43,260 | $10,500 | $32,760 |
| 2012 | -- | $53,720 | $13,300 | $40,420 |
Source: Public Records
Map
Nearby Homes
- 1109 Sundance Dr
- 1803 Cudgell Dr
- 857 Lea Castle Place
- 429 Wilson Park Dr
- 1232 Hollyhill Dr
- 838 Maid Marion Ct
- 00 Heincke Rd
- 1000 Skyview Dr
- 700 N Gebhart Church Rd
- 2125 Sherwood Forest Dr
- 703 Friar Tuck Ct
- 2302 King Richard Pkwy
- 308 Ironwood Dr
- 257 Ironwood Dr
- 250 Grantwood Dr
- 1121 Dayket Cir
- 860 Mardel Dr
- 1678 Carolyn Dr
- 722 Peach Orchard Dr
- 1100 S Elm St
- 1546 Hickory Glenn Dr
- 1606 Hickory Glenn Dr
- 1555 Sherwood Forest Dr
- 1565 Sherwood Forest Dr
- 1536 Hickory Glenn Dr
- 1203 Pine Knoll Ct
- 1545 Sherwood Forest Dr
- 1575 Sherwood Forest Dr
- 1535 Sherwood Forest Dr
- 1526 Hickory Glenn Dr
- 1626 Hickory Glenn Dr
- 1535 Hickory Glenn Dr
- 1605 Sherwood Forest Dr
- 7901 Granite Peak Way
- 1213 Pine Knoll Ct
- 1202 Pine Knoll Ct
- 1525 Hickory Glenn Dr
- 1525 Sherwood Forest Dr
- 1556 Sherwood Forest Dr
- 1615 Sherwood Forest Dr