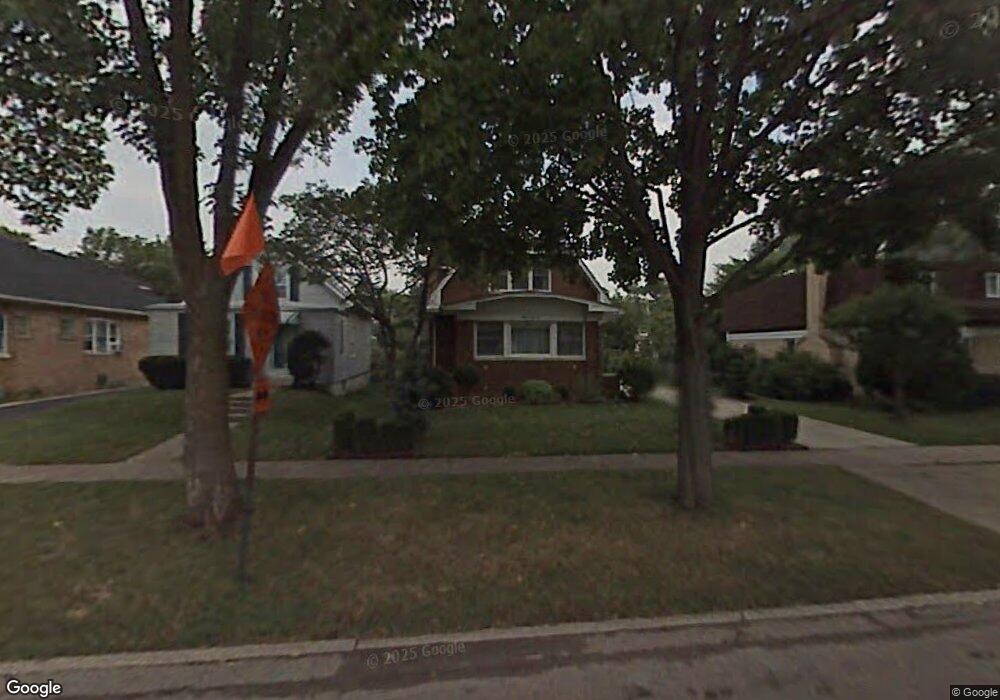
1556 Whitcomb Ave Des Plaines, IL 60018
Estimated Value: $410,894 - $486,000
4
Beds
3
Baths
1,674
Sq Ft
$263/Sq Ft
Est. Value
About This Home
This home is located at 1556 Whitcomb Ave, Des Plaines, IL 60018 and is currently estimated at $440,224, approximately $262 per square foot. 1556 Whitcomb Ave is a home located in Cook County with nearby schools including Central Elementary School, Chippewa Middle School, and Maine West High School.
Ownership History
Date
Name
Owned For
Owner Type
Purchase Details
Closed on
Apr 19, 2017
Sold by
Blackmore Bradlee A and Blackmore Dana M
Bought by
Nickl Peter K and Nickl Nicole E
Current Estimated Value
Home Financials for this Owner
Home Financials are based on the most recent Mortgage that was taken out on this home.
Original Mortgage
$270,000
Outstanding Balance
$224,075
Interest Rate
4.37%
Mortgage Type
New Conventional
Estimated Equity
$216,149
Purchase Details
Closed on
Aug 4, 2010
Sold by
Casey Eileen
Bought by
Blackmore Bradlee A and Blackmore Dana M
Home Financials for this Owner
Home Financials are based on the most recent Mortgage that was taken out on this home.
Original Mortgage
$281,213
Interest Rate
4.75%
Mortgage Type
FHA
Purchase Details
Closed on
Jul 24, 2000
Sold by
Grooms John P and Grooms Diane G
Bought by
Casey Eileen
Home Financials for this Owner
Home Financials are based on the most recent Mortgage that was taken out on this home.
Original Mortgage
$170,000
Interest Rate
7.87%
Create a Home Valuation Report for This Property
The Home Valuation Report is an in-depth analysis detailing your home's value as well as a comparison with similar homes in the area
Home Values in the Area
Average Home Value in this Area
Purchase History
| Date | Buyer | Sale Price | Title Company |
|---|---|---|---|
| Nickl Peter K | $353,000 | Baird And Warner Title Servi | |
| Blackmore Bradlee A | $285,000 | Multiple | |
| Casey Eileen | -- | Professional National Title |
Source: Public Records
Mortgage History
| Date | Status | Borrower | Loan Amount |
|---|---|---|---|
| Open | Nickl Peter K | $270,000 | |
| Previous Owner | Blackmore Bradlee A | $281,213 | |
| Previous Owner | Casey Eileen | $170,000 |
Source: Public Records
Tax History
| Year | Tax Paid | Tax Assessment Tax Assessment Total Assessment is a certain percentage of the fair market value that is determined by local assessors to be the total taxable value of land and additions on the property. | Land | Improvement |
|---|---|---|---|---|
| 2025 | $7,888 | $40,000 | $9,234 | $30,766 |
| 2024 | $7,888 | $33,234 | $8,208 | $25,026 |
| 2023 | $7,671 | $33,234 | $8,208 | $25,026 |
| 2022 | $7,671 | $33,234 | $8,208 | $25,026 |
| 2021 | $7,259 | $26,944 | $6,669 | $20,275 |
| 2020 | $7,205 | $26,944 | $6,669 | $20,275 |
| 2019 | $7,134 | $29,938 | $6,669 | $23,269 |
| 2018 | $6,461 | $25,040 | $5,899 | $19,141 |
| 2017 | $7,356 | $25,040 | $5,899 | $19,141 |
| 2016 | $6,958 | $25,040 | $5,899 | $19,141 |
| 2015 | $7,507 | $24,832 | $5,130 | $19,702 |
| 2014 | $7,349 | $24,832 | $5,130 | $19,702 |
| 2013 | $7,166 | $24,832 | $5,130 | $19,702 |
Source: Public Records
Map
Nearby Homes
- 1700 E Forest Ave
- 1630 Henry Ave
- 1509 Center St
- 1524 Oakwood Ave
- 1638 Oakwood Ave
- 1645 Illinois St
- 1380 Oakwood Ave Unit 306
- 1649 Ashland Ave Unit 501
- 905 Center St Unit B208
- 1689 S Elm St
- 1990 Berry Ln
- 900 Center St Unit 3A
- 1600 E Thacker St Unit 513
- 1640 S River Rd
- 1277 E Thacker St Unit 303
- 821 Lexington Cir E
- 770 Pearson St Unit 808
- 1080 Bogart St
- 750 Pearson St Unit 904
- 787 Graceland Ave Unit 202B
- 1540 Whitcomb Ave
- 1570 Whitcomb Ave
- 1530 Whitcomb Ave
- 1580 Whitcomb Ave
- 1518 Whitcomb Ave
- 1561 Van Buren Ave
- 1590 Whitcomb Ave
- 1541 Van Buren Ave
- 1571 Van Buren Ave
- 1504 Whitcomb Ave
- 1289 S Cora St
- 1555 Whitcomb Ave
- 1571 Whitcomb Ave
- 1523 Van Buren Ave
- 1581 Van Buren Ave
- 1596 Whitcomb Ave
- 1539 Whitcomb Ave
- 1269 S Cora St
- 1585 Whitcomb Ave
- 1263 S Cora St
Your Personal Tour Guide
Ask me questions while you tour the home.