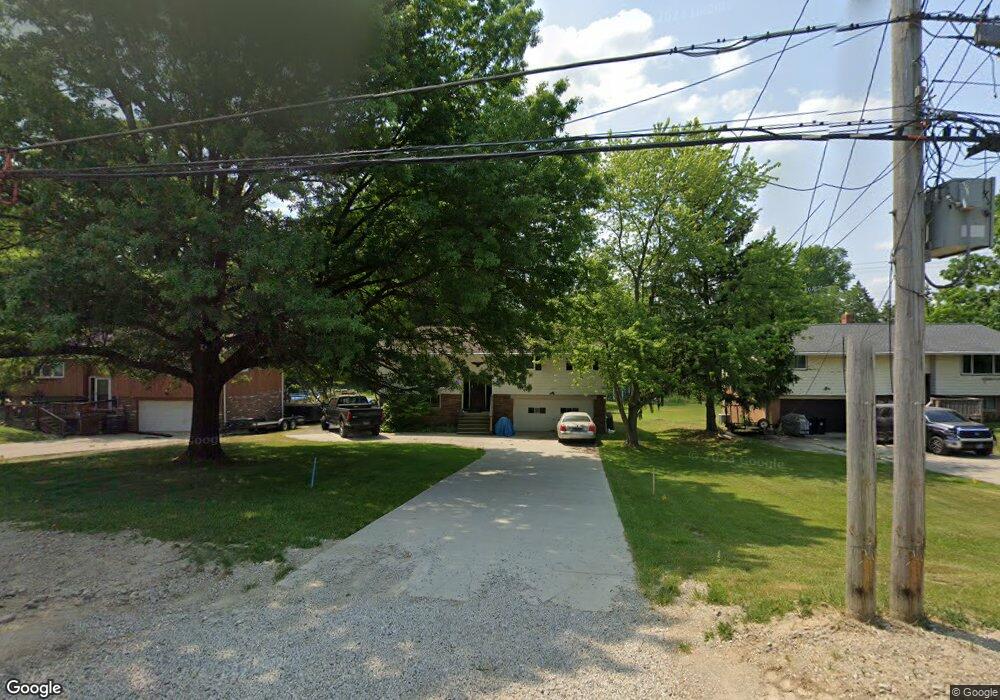
15563 Albion Rd Strongsville, OH 44136
Estimated Value: $259,000 - $300,000
3
Beds
2
Baths
1,778
Sq Ft
$160/Sq Ft
Est. Value
About This Home
This home is located at 15563 Albion Rd, Strongsville, OH 44136 and is currently estimated at $284,779, approximately $160 per square foot. 15563 Albion Rd is a home located in Cuyahoga County with nearby schools including Strongsville High School, Sts Joseph & John Interparochial School, and Royal Redeemer Lutheran School.
Ownership History
Date
Name
Owned For
Owner Type
Purchase Details
Closed on
Apr 10, 2024
Sold by
Hudak Frederick B and Hudak Toni T
Bought by
Hudak Preservation Trust and Markim
Current Estimated Value
Purchase Details
Closed on
May 24, 1998
Sold by
Tolley James O and Tolley Betty Jo
Bought by
Hudak Frederick B and Hudak Toni T
Home Financials for this Owner
Home Financials are based on the most recent Mortgage that was taken out on this home.
Original Mortgage
$101,000
Interest Rate
7.27%
Purchase Details
Closed on
Jun 29, 1983
Bought by
Tolley James O and Betty Jo
Purchase Details
Closed on
Dec 28, 1982
Sold by
Villella Michael D
Bought by
Park View Fed S&L Assoc
Purchase Details
Closed on
Nov 21, 1980
Sold by
Forastiero Elaine
Bought by
Villella Michael D
Purchase Details
Closed on
Jan 1, 1975
Bought by
Forastiero Elaine
Create a Home Valuation Report for This Property
The Home Valuation Report is an in-depth analysis detailing your home's value as well as a comparison with similar homes in the area
Home Values in the Area
Average Home Value in this Area
Purchase History
| Date | Buyer | Sale Price | Title Company |
|---|---|---|---|
| Hudak Preservation Trust | -- | None Listed On Document | |
| Hudak Frederick B | $128,000 | National Title Agency | |
| Tolley James O | $65,500 | -- | |
| Park View Fed S&L Assoc | -- | -- | |
| Villella Michael D | $60,000 | -- | |
| Forastiero Elaine | -- | -- |
Source: Public Records
Mortgage History
| Date | Status | Borrower | Loan Amount |
|---|---|---|---|
| Previous Owner | Hudak Frederick B | $101,000 |
Source: Public Records
Tax History Compared to Growth
Tax History
| Year | Tax Paid | Tax Assessment Tax Assessment Total Assessment is a certain percentage of the fair market value that is determined by local assessors to be the total taxable value of land and additions on the property. | Land | Improvement |
|---|---|---|---|---|
| 2024 | $4,389 | $78,785 | $18,235 | $60,550 |
| 2023 | $4,171 | $65,210 | $17,570 | $47,640 |
| 2022 | $4,142 | $65,210 | $17,570 | $47,640 |
| 2021 | $4,113 | $65,210 | $17,570 | $47,640 |
| 2020 | $3,907 | $54,810 | $14,770 | $40,040 |
| 2019 | $3,795 | $156,600 | $42,200 | $114,400 |
| 2018 | $3,452 | $54,810 | $14,770 | $40,040 |
| 2017 | $3,439 | $50,550 | $11,660 | $38,890 |
| 2016 | $3,412 | $50,550 | $11,660 | $38,890 |
| 2015 | $3,361 | $50,550 | $11,660 | $38,890 |
| 2014 | $3,361 | $49,080 | $11,310 | $37,770 |
Source: Public Records
Map
Nearby Homes
- 0 Webster Rd
- 9945 Twelve Oaks Cir
- 10369 Council Bluff
- 16519 Albion Rd
- 10010 Chevy Chase
- 9890 Webster Rd
- 14069 Basswood Cir
- 14584 Baywood Ln
- 14557 Baywood Ln
- 14644 Baywood Ln
- 14298 Calderdale Ln
- 9129 Tahoe Cir
- 9531 Nicole Cir
- 12199 Webster Rd
- 12101 The Bluffs
- 13402 Bridgecreek Cir
- Buchanan Plan at The Enclave at Pine Lakes Crossing
- Belleville Plan at The Enclave at Pine Lakes Crossing
- 11650 River Moss Rd
- 17945 Cliffside Dr
- 15523 Albion Rd
- 15603 Albion Rd
- 15477 Albion Rd
- 15602 Albion Rd
- 15560 Albion Rd
- 15401 Albion Rd
- 15705 Albion Rd
- 15644 Albion Rd
- 15522 Albion Rd
- 15393 Albion Rd
- 15650 Albion Rd
- 10495 Ruggiero Dr
- 15686 Albion Rd
- 10517 Ruggiero Dr
- 15353 Albion Rd
- 10539 Ruggiero Dr
- 0 Albion Rd Unit 3621152
- 12345 S L 12 Albion
- 15432 Albion Rd
- 10471 Ruggiero Dr