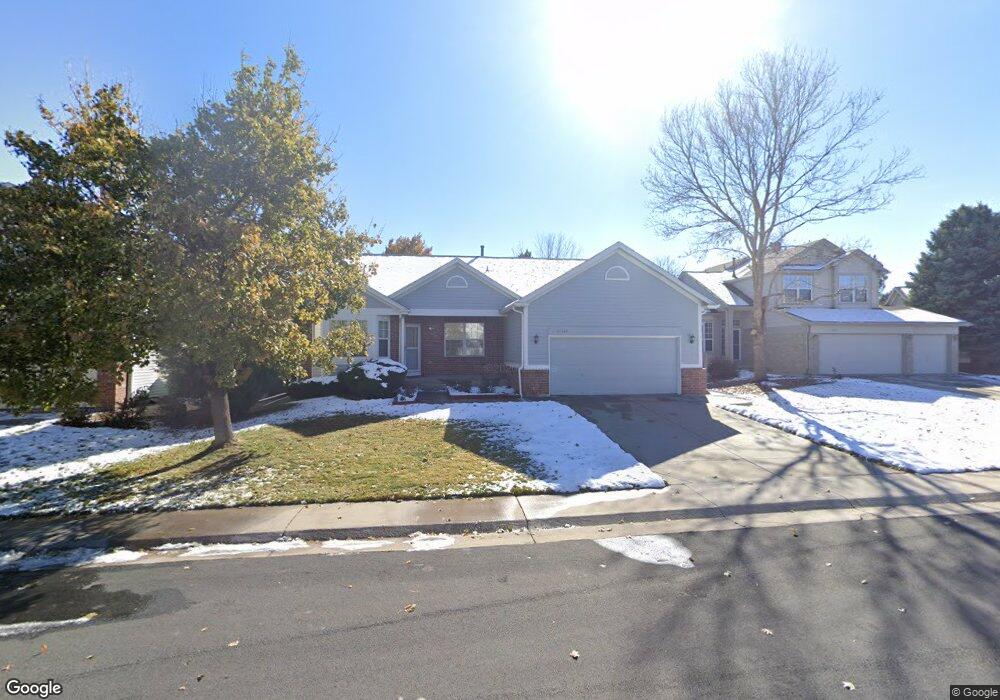
15564 E Quincy Place Aurora, CO 80015
Pheasant Run NeighborhoodEstimated Value: $562,670 - $625,000
4
Beds
2
Baths
3,434
Sq Ft
$172/Sq Ft
Est. Value
About This Home
This home is located at 15564 E Quincy Place, Aurora, CO 80015 and is currently estimated at $589,668, approximately $171 per square foot. 15564 E Quincy Place is a home located in Arapahoe County with nearby schools including Independence Elementary School, Laredo Middle School, and Smoky Hill High School.
Ownership History
Date
Name
Owned For
Owner Type
Purchase Details
Closed on
Nov 19, 2009
Sold by
Gorelik Michael and Gorelik Yanna
Bought by
Ye Wei and You Li Jun
Current Estimated Value
Home Financials for this Owner
Home Financials are based on the most recent Mortgage that was taken out on this home.
Original Mortgage
$194,400
Outstanding Balance
$122,786
Interest Rate
4.37%
Mortgage Type
New Conventional
Estimated Equity
$466,882
Purchase Details
Closed on
Jun 24, 1994
Sold by
Pulte Home Corp
Bought by
Gorelik Michael and Gorelik Yanna
Home Financials for this Owner
Home Financials are based on the most recent Mortgage that was taken out on this home.
Original Mortgage
$162,100
Interest Rate
8.75%
Create a Home Valuation Report for This Property
The Home Valuation Report is an in-depth analysis detailing your home's value as well as a comparison with similar homes in the area
Home Values in the Area
Average Home Value in this Area
Purchase History
| Date | Buyer | Sale Price | Title Company |
|---|---|---|---|
| Ye Wei | $243,000 | Land Title Guarantee Company | |
| Gorelik Michael | $180,150 | Land Title |
Source: Public Records
Mortgage History
| Date | Status | Borrower | Loan Amount |
|---|---|---|---|
| Open | Ye Wei | $194,400 | |
| Previous Owner | Gorelik Michael | $162,100 |
Source: Public Records
Tax History Compared to Growth
Tax History
| Year | Tax Paid | Tax Assessment Tax Assessment Total Assessment is a certain percentage of the fair market value that is determined by local assessors to be the total taxable value of land and additions on the property. | Land | Improvement |
|---|---|---|---|---|
| 2024 | $2,611 | $37,741 | -- | -- |
| 2023 | $2,611 | $37,741 | $0 | $0 |
| 2022 | $2,151 | $29,698 | $0 | $0 |
| 2021 | $2,165 | $29,698 | $0 | $0 |
| 2020 | $1,940 | $27,013 | $0 | $0 |
| 2019 | $1,872 | $27,013 | $0 | $0 |
| 2018 | $1,933 | $26,215 | $0 | $0 |
| 2017 | $1,905 | $26,215 | $0 | $0 |
| 2016 | $1,817 | $23,442 | $0 | $0 |
| 2015 | $1,729 | $23,442 | $0 | $0 |
| 2014 | $1,450 | $17,424 | $0 | $0 |
| 2013 | -- | $19,440 | $0 | $0 |
Source: Public Records
Map
Nearby Homes
- 4436 S Kalispell Cir
- 4117 S Hannibal St
- 3994 S Idalia St
- 16038 E Oxford Dr
- 4149 S Lewiston St
- 4575 S Kittredge St
- 4609 S Kalispell Way
- 4557 S Laredo St
- 4109 S Evanston Cir Unit B
- 14853 E Radcliff Place
- 15552 E Temple Place
- 4130 S Laredo Way
- 4614 S Kalispell Way
- 15716 E Temple Place
- 4477 S Eagle Cir
- 4638 S Kittredge St
- 4229 S Mobile Cir Unit B
- 4663 S Fraser Ct Unit E
- 4602 S Lewiston Way
- 4105 S Laredo Way
- 15584 E Quincy Place
- 15544 E Quincy Place
- 15594 E Quincy Place
- 15565 E Quinn Place
- 15545 E Quinn Place
- 15534 E Quincy Place
- 15585 E Quinn Place
- 15535 E Quinn Place
- 15563 E Quincy Place
- 15595 E Quinn Place
- 15583 E Quincy Place
- 15543 E Quincy Place
- 15524 E Quincy Place
- 15593 E Quincy Place
- 15523 E Quincy Place
- 15525 E Quinn Place
- 15533 E Quincy Place
- 4340 S Idalia Way
- 4330 S Idalia Way
- 4350 S Idalia Way