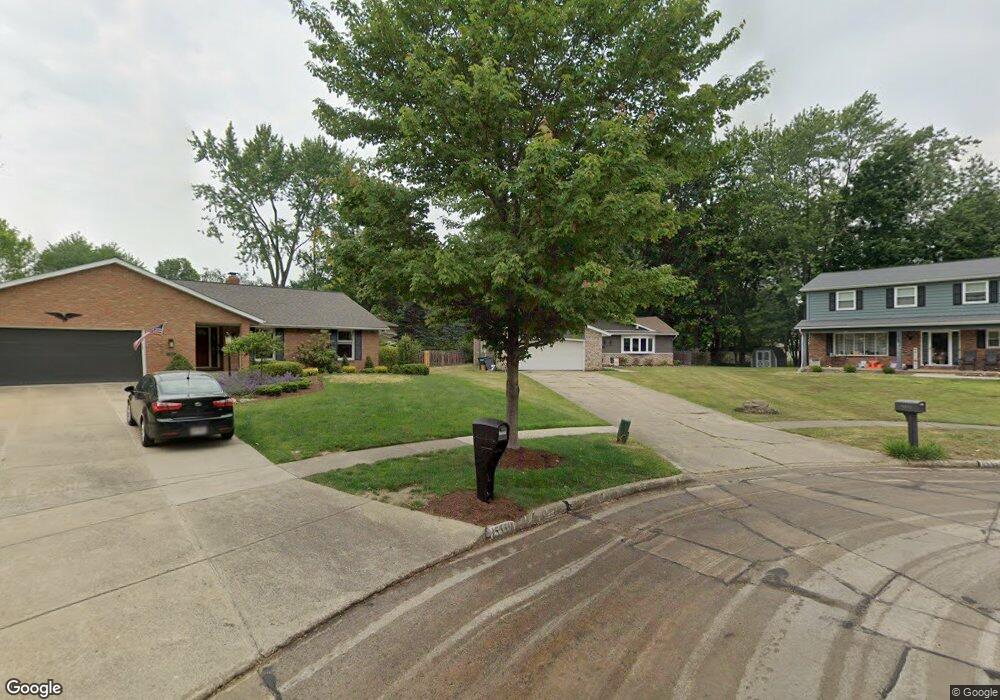
15565 Pecan Oval Middleburg Heights, OH 44130
Estimated Value: $360,000 - $384,000
4
Beds
3
Baths
2,557
Sq Ft
$144/Sq Ft
Est. Value
About This Home
This home is located at 15565 Pecan Oval, Middleburg Heights, OH 44130 and is currently estimated at $368,074, approximately $143 per square foot. 15565 Pecan Oval is a home located in Cuyahoga County with nearby schools including Big Creek Elementary School, Berea-Midpark Middle School, and Berea-Midpark High School.
Ownership History
Date
Name
Owned For
Owner Type
Purchase Details
Closed on
Jan 29, 2014
Sold by
Jones Lynn
Bought by
Drabik Christopher K and Drabik Alison E
Current Estimated Value
Home Financials for this Owner
Home Financials are based on the most recent Mortgage that was taken out on this home.
Original Mortgage
$142,373
Outstanding Balance
$107,719
Interest Rate
4.37%
Mortgage Type
FHA
Estimated Equity
$260,355
Purchase Details
Closed on
Apr 9, 1996
Sold by
Borling Gerald H
Bought by
Birk Patrick E and Birk Beth A
Home Financials for this Owner
Home Financials are based on the most recent Mortgage that was taken out on this home.
Original Mortgage
$100,000
Interest Rate
7.36%
Mortgage Type
New Conventional
Purchase Details
Closed on
May 5, 1977
Bought by
Borling Gerald H
Purchase Details
Closed on
Jan 1, 1975
Bought by
Arrowhead Land Inc
Create a Home Valuation Report for This Property
The Home Valuation Report is an in-depth analysis detailing your home's value as well as a comparison with similar homes in the area
Home Values in the Area
Average Home Value in this Area
Purchase History
| Date | Buyer | Sale Price | Title Company |
|---|---|---|---|
| Drabik Christopher K | $145,000 | Land Title Group | |
| Birk Patrick E | $162,500 | -- | |
| Borling Gerald H | $79,900 | -- | |
| Wm Bailey Construction Inc | $18,800 | -- | |
| Arrowhead Land Inc | -- | -- |
Source: Public Records
Mortgage History
| Date | Status | Borrower | Loan Amount |
|---|---|---|---|
| Open | Drabik Christopher K | $142,373 | |
| Previous Owner | Birk Patrick E | $100,000 |
Source: Public Records
Tax History Compared to Growth
Tax History
| Year | Tax Paid | Tax Assessment Tax Assessment Total Assessment is a certain percentage of the fair market value that is determined by local assessors to be the total taxable value of land and additions on the property. | Land | Improvement |
|---|---|---|---|---|
| 2024 | $5,287 | $102,900 | $14,945 | $87,955 |
| 2023 | $4,785 | $76,970 | $12,220 | $64,750 |
| 2022 | $4,752 | $76,965 | $12,215 | $64,750 |
| 2021 | $4,725 | $76,970 | $12,220 | $64,750 |
| 2020 | $4,919 | $70,600 | $11,200 | $59,400 |
| 2019 | $4,775 | $201,700 | $32,000 | $169,700 |
| 2018 | $4,755 | $70,600 | $11,200 | $59,400 |
| 2017 | $4,790 | $65,700 | $10,750 | $54,950 |
| 2016 | $4,751 | $65,700 | $10,750 | $54,950 |
| 2015 | $4,465 | $65,700 | $10,750 | $54,950 |
| 2014 | $4,465 | $65,700 | $10,750 | $54,950 |
Source: Public Records
Map
Nearby Homes
- 6771 Wood Creek Dr
- 6749 Middlebrook Blvd
- 15510 Sandalhaven Dr
- 6943 N Parkway Dr Unit H6943
- 6566 Elmdale Rd
- 6736 Rockridge Ct
- 6710 Woodruff Ct
- 15446 Sheldon Rd
- 6736 Columbine Ct
- 6809 Meadow Ln
- 6491 Smith Rd
- 13689 Pineview Ct
- 6359 Middlebrook Blvd
- 15983 Galemore Dr
- 6823 Fry Rd
- 6689 Fry Rd
- 16259 Emerald Point Unit 16259
- 6470 Sandfield Dr
- 16761 Orchard Grove Dr Unit 6808A
- 13879 Zaremba Dr
- 15568 Pecan Oval
- 15559 Pecan Oval
- 15562 Cottonwood Oval
- 15556 Cottonwood Oval
- 15553 Pecan Oval
- 15562 Pecan Oval
- 15568 Cottonwood Oval
- 15550 Cottonwood Oval
- 15556 Pecan Oval
- 6797 Franke Rd
- 6807 Franke Rd
- 15550 Pecan Oval
- 6805 Franke Rd
- 6798 Wood Creek Dr
- 6799 Franke Rd
- 15571 Cottonwood Oval
- 6793 Franke Rd
- 6817 Franke Rd
- 6813 Wood Creek Dr
- 6807 Wood Creek Dr