15567 Markey Ln Garfield, AR 72732
Estimated Value: $434,000 - $523,000
Studio
3
Baths
1,820
Sq Ft
$259/Sq Ft
Est. Value
About This Home
This home is located at 15567 Markey Ln, Garfield, AR 72732 and is currently estimated at $470,565, approximately $258 per square foot. 15567 Markey Ln is a home located in Benton County with nearby schools including Garfield Elementary School, Lingle Middle School, and Rogers Heritage High School.
Ownership History
Date
Name
Owned For
Owner Type
Purchase Details
Closed on
Feb 27, 2017
Sold by
Mulkey Scotty R and Mulkey Laura Y
Bought by
Mcneece Andrew and Mcneece Courtney
Current Estimated Value
Purchase Details
Closed on
May 20, 2011
Sold by
U S Bank National Association and Roppe Jill E
Bought by
Pratt Laura Y and Mulkey Scotty R
Purchase Details
Closed on
Feb 10, 2011
Bought by
Us Bank National
Purchase Details
Closed on
May 23, 2003
Bought by
Gregrich
Purchase Details
Closed on
Feb 15, 2002
Bought by
Gregrich Tr
Purchase Details
Closed on
Sep 19, 2001
Bought by
Gregrich
Purchase Details
Closed on
Feb 28, 1997
Bought by
Gregrich
Purchase Details
Closed on
Feb 8, 1994
Bought by
Snoderly
Purchase Details
Closed on
Feb 8, 1988
Bought by
Nichols-Franks Rev On Wrong De
Purchase Details
Closed on
Nov 17, 1987
Bought by
Franks
Create a Home Valuation Report for This Property
The Home Valuation Report is an in-depth analysis detailing your home's value as well as a comparison with similar homes in the area
Purchase History
| Date | Buyer | Sale Price | Title Company |
|---|---|---|---|
| Mcneece Andrew | $195,000 | Pci Advance Title Llc | |
| Pratt Laura Y | $66,000 | Professional Land Title Comp | |
| Us Bank National | -- | -- | |
| U S Bank National Association Nd | $156,000 | None Available | |
| Gregrich | -- | -- | |
| Gregrich Tr | -- | -- | |
| Re: Gregrich Tr | -- | -- | |
| Gregrich | -- | -- | |
| Gregrich | $10,000 | -- | |
| Snoderly | $7,000 | -- | |
| Nichols-Franks Rev On Wrong De | -- | -- | |
| Franks | $28,000 | -- |
Source: Public Records
Tax History
| Year | Tax Paid | Tax Assessment Tax Assessment Total Assessment is a certain percentage of the fair market value that is determined by local assessors to be the total taxable value of land and additions on the property. | Land | Improvement |
|---|---|---|---|---|
| 2025 | $2,092 | $78,926 | $6,751 | $72,175 |
| 2024 | $1,883 | $78,926 | $6,751 | $72,175 |
| 2023 | $1,794 | $47,510 | $4,900 | $42,610 |
| 2022 | $1,724 | $47,510 | $4,900 | $42,610 |
| 2021 | $1,635 | $47,510 | $4,900 | $42,610 |
| 2020 | $1,554 | $32,440 | $1,510 | $30,930 |
| 2019 | $1,554 | $32,440 | $1,510 | $30,930 |
| 2018 | $1,656 | $35,490 | $4,560 | $30,930 |
| 2017 | $1,656 | $35,490 | $4,560 | $30,930 |
| 2016 | $1,882 | $35,490 | $4,560 | $30,930 |
| 2015 | $1,762 | $36,630 | $5,900 | $30,730 |
| 2014 | $1,937 | $36,630 | $5,900 | $30,730 |
Source: Public Records
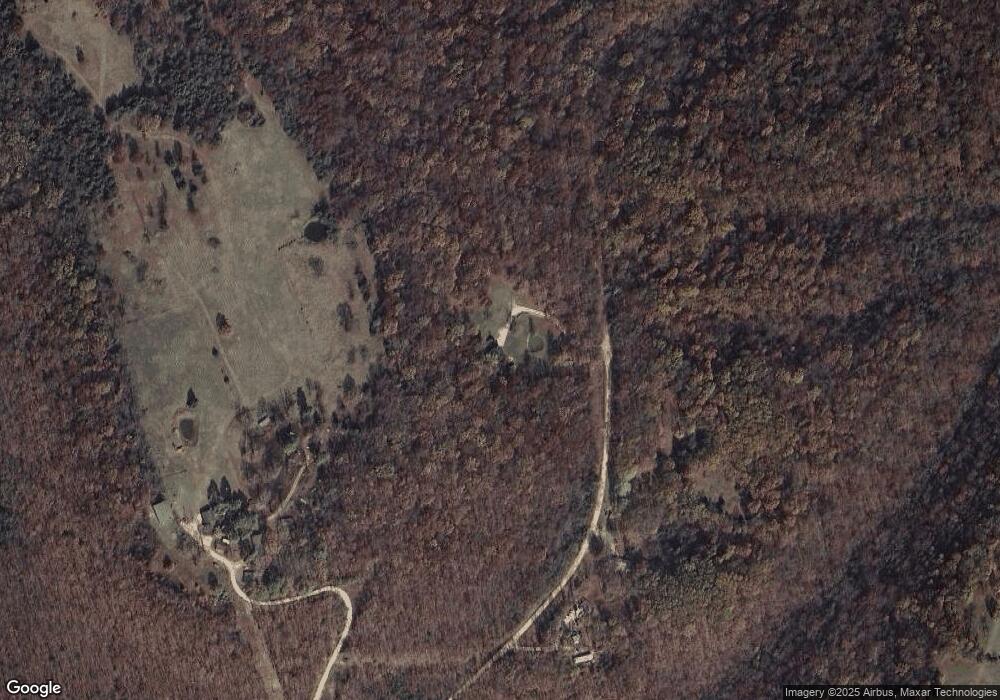
Map
Nearby Homes
- 15360 N Wimpy Jones Rd
- 17619 Dennis Mitchell Rd
- 22AC Gann Ridge Rd
- 18775 Highway 62
- 14620 Ravenwood Ln
- 16856 Mahurin Loop
- 16996 Bill Billings Rd
- 15990 N Wimpy Jones Rd
- 13AC Gann Ridge Rd
- 18440 Beaver Hollow Rd
- 0 Bill Billings Rd
- 14.443 ac Byler Rd
- 15936 Skyline Dr
- 17008 Scott Cemetery Rd
- 13977 Elkhorn Rd
- 13751 Ventris Rd
- Tract 3 Sugar Creek Rd
- 15047 U S 62
- 17475 Scott Cemetery Rd
- 14998 Highway 62
- 15562 Markey Ln
- 15760 Markey Ln
- 15440 Markey Ln
- 0 Markey Ln Unit 1069226
- 15394 Markey Ln
- 15396 Markey Ln
- 15365 Markey Ln
- 15386 Markey Ln
- 0 N Old Wire Rd Unit 489360
- 0 N Old Wire Rd Unit 347253
- 0 N Old Wire Rd Unit 335078
- 0 N Old Wire Rd Unit 378499
- 0 N Old Wire Rd Unit 287863
- 0 N Old Wire Rd Unit 1237412
- 0 N Old Wire Rd Unit 611606
- 0 N Old Wire Rd Unit 741430
- 0 N Old Wire Rd Unit 1059599
- 0 N Old Wire Rd Unit 1138163
- 0 N Old Wire Rd Unit 1182675
- 15353 Markey Ln
Your Personal Tour Guide
Ask me questions while you tour the home.