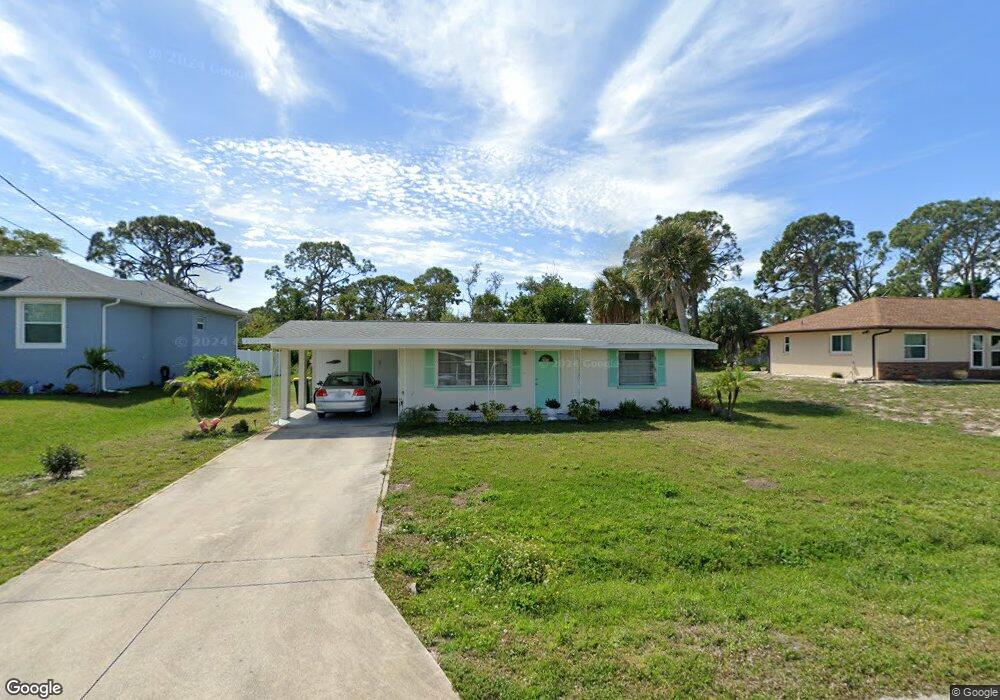
1557 David Place Englewood, FL 34223
Englewood South NeighborhoodEstimated Value: $151,000 - $208,000
2
Beds
1
Bath
816
Sq Ft
$217/Sq Ft
Est. Value
About This Home
This home is located at 1557 David Place, Englewood, FL 34223 and is currently estimated at $177,114, approximately $217 per square foot. 1557 David Place is a home located in Charlotte County with nearby schools including Myakka River Elementary School, L.A. Ainger Middle School, and Lemon Bay High School.
Ownership History
Date
Name
Owned For
Owner Type
Purchase Details
Closed on
Dec 28, 2023
Sold by
May James A and May Patricia Jane
Bought by
May James A and May James A
Current Estimated Value
Purchase Details
Closed on
Dec 22, 2023
Sold by
May Family Living Trust
Bought by
May Family Living Trust and May
Purchase Details
Closed on
Jan 25, 2021
Sold by
May James A and May Jane P
Bought by
May James A and May Patricia Jane
Purchase Details
Closed on
Mar 21, 2011
Sold by
Hallock Carla A
Bought by
Sweeny May James A and Sweeny May P Jane
Purchase Details
Closed on
Nov 15, 2004
Sold by
Theriault Russell J and The Estate Of Gertrude H Terri
Bought by
Hallock Carla A
Home Financials for this Owner
Home Financials are based on the most recent Mortgage that was taken out on this home.
Original Mortgage
$95,000
Interest Rate
5.77%
Mortgage Type
Purchase Money Mortgage
Create a Home Valuation Report for This Property
The Home Valuation Report is an in-depth analysis detailing your home's value as well as a comparison with similar homes in the area
Home Values in the Area
Average Home Value in this Area
Purchase History
| Date | Buyer | Sale Price | Title Company |
|---|---|---|---|
| May James A | $100 | None Listed On Document | |
| May Family Living Trust | $100 | None Listed On Document | |
| May James A | -- | Accommodation | |
| Sweeny May James A | $28,000 | Attorney | |
| Hallock Carla A | $115,000 | Executive Title Ins Svcs Inc |
Source: Public Records
Mortgage History
| Date | Status | Borrower | Loan Amount |
|---|---|---|---|
| Previous Owner | Hallock Carla A | $95,000 |
Source: Public Records
Tax History Compared to Growth
Tax History
| Year | Tax Paid | Tax Assessment Tax Assessment Total Assessment is a certain percentage of the fair market value that is determined by local assessors to be the total taxable value of land and additions on the property. | Land | Improvement |
|---|---|---|---|---|
| 2024 | $2,586 | $171,088 | $33,134 | $137,954 |
| 2023 | $2,586 | $166,624 | $30,294 | $136,330 |
| 2022 | $2,193 | $120,721 | $22,090 | $98,631 |
| 2021 | $1,973 | $92,808 | $16,094 | $76,714 |
| 2020 | $1,860 | $86,739 | $14,200 | $72,539 |
| 2019 | $1,689 | $77,305 | $14,200 | $63,105 |
| 2018 | $1,507 | $74,537 | $14,200 | $60,337 |
| 2017 | $1,401 | $63,528 | $12,623 | $50,905 |
| 2016 | $1,222 | $41,686 | $0 | $0 |
| 2015 | $1,084 | $37,896 | $0 | $0 |
| 2014 | $943 | $34,451 | $0 | $0 |
Source: Public Records
Map
Nearby Homes
- 901 Oxford Dr
- 1511 Lakeview Place
- 1493 Kathleen Place
- 1651 Lakeview Place
- 1635 David Place
- 1691 Lakeview Place
- 1530 Rossanne Place
- 760 S Oxford Dr
- 1225 S Oxford Dr
- 857 Palmetto St
- 2 Bertrend St
- 1410 San Jose Dr
- 1255 S Maryknoll Rd
- 1710 Loralin Dr
- 735 Bertrend St
- 1295 S Maryknoll Rd
- 801 E 5th St
- 240 Riverview Ave
- 1690 Elinor Place
- 800 E 4th St
- 1569 David Place
- 1555 David Place
- 1575 David Place
- 1549 David Place
- 1560 David Place
- 1580 Eileen Place
- 1570 David Place
- 1540 Eileen Place
- 1585 David Place
- 1529 David Place
- 1580 David Place
- 1530 David Place
- 1590 Eileen Place
- 1590 David Place
- 1557 Eileen Place
- 1549 Eileen Place
- 1601 David Place
- 1520 David Place
- 1500 Eileen Place