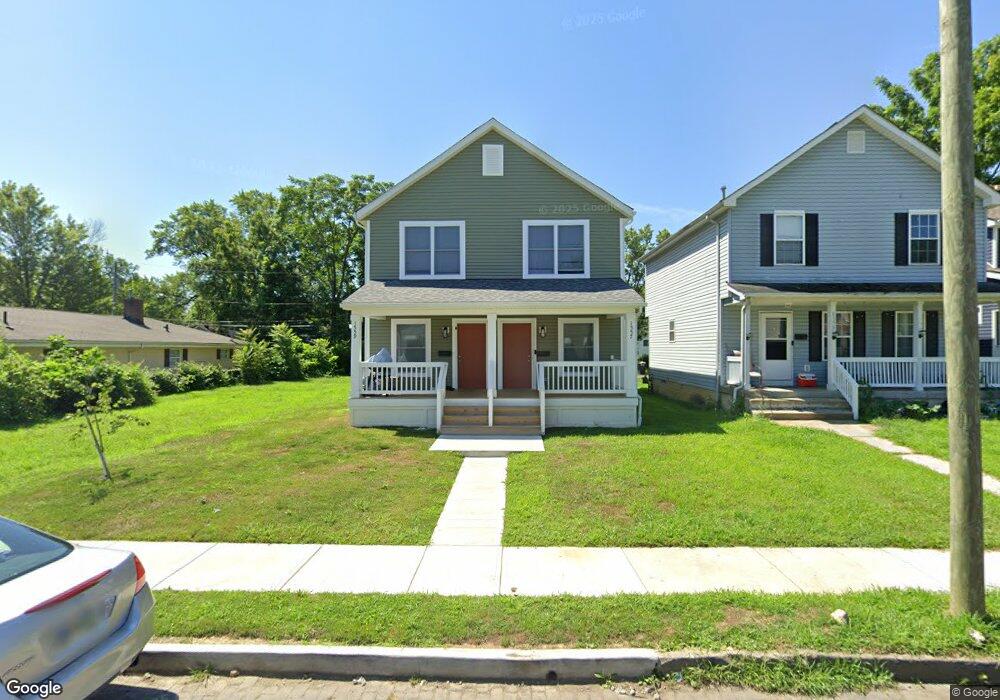
1557 E Maynard Ave Columbus, OH 43211
South Linden NeighborhoodEstimated Value: $37,340 - $89,000
3
Beds
1
Bath
1,142
Sq Ft
$62/Sq Ft
Est. Value
About This Home
This home is located at 1557 E Maynard Ave, Columbus, OH 43211 and is currently estimated at $70,835, approximately $62 per square foot. 1557 E Maynard Ave is a home located in Franklin County with nearby schools including Linden-Mckinley Stem School On Arcadia, North Columbus Preparatory Academy, and Midnimo Cross Cultural Middle School.
Ownership History
Date
Name
Owned For
Owner Type
Purchase Details
Closed on
Nov 8, 2023
Sold by
City Of Columbus Ohio
Bought by
Healthy Linden Homes Iii Lc
Current Estimated Value
Purchase Details
Closed on
Aug 11, 2023
Sold by
Central Ohio Community Improvement Corpo
Bought by
City Of Columbus Ohio
Purchase Details
Closed on
May 12, 2014
Sold by
Line Away Inc
Bought by
City Of Columbus
Purchase Details
Closed on
Feb 28, 2007
Sold by
The Tree Network Co Llc
Bought by
Line Away Inc
Purchase Details
Closed on
Feb 13, 2007
Sold by
Fannie Mae
Bought by
The Tree Network Co Llc
Purchase Details
Closed on
Aug 17, 2006
Sold by
Carter Kristien N
Bought by
Federal National Mortgage Association
Purchase Details
Closed on
Nov 29, 2004
Sold by
Va
Bought by
Anderson Myra M
Home Financials for this Owner
Home Financials are based on the most recent Mortgage that was taken out on this home.
Original Mortgage
$122,747
Interest Rate
5.78%
Mortgage Type
Purchase Money Mortgage
Purchase Details
Closed on
Jan 6, 2004
Sold by
Townsend Charles W
Bought by
Carter Kristien N
Home Financials for this Owner
Home Financials are based on the most recent Mortgage that was taken out on this home.
Original Mortgage
$71,250
Interest Rate
5.78%
Mortgage Type
Purchase Money Mortgage
Purchase Details
Closed on
Oct 22, 2002
Sold by
Kimmel Brook Properties Llc
Bought by
Townsend Charles W
Purchase Details
Closed on
Sep 24, 2002
Sold by
Wright Dwayne and Wright Investments
Bought by
Kimmel Brook Properties Llc
Purchase Details
Closed on
Jun 4, 2002
Sold by
Beebles Investment Inc
Bought by
Trf Properties Inc
Purchase Details
Closed on
Jun 1, 2002
Sold by
Trf Properties Inc
Bought by
Wright Investments
Purchase Details
Closed on
Sep 19, 2001
Sold by
Curry Wheat Jerald E and Curry Mischa Y
Bought by
Beebles Investment Inc
Purchase Details
Closed on
Mar 19, 1984
Bought by
Wheat Jerald E
Create a Home Valuation Report for This Property
The Home Valuation Report is an in-depth analysis detailing your home's value as well as a comparison with similar homes in the area
Home Values in the Area
Average Home Value in this Area
Purchase History
| Date | Buyer | Sale Price | Title Company |
|---|---|---|---|
| Healthy Linden Homes Iii Lc | $3,789 | None Listed On Document | |
| City Of Columbus Ohio | -- | None Listed On Document | |
| City Of Columbus | -- | None Available | |
| Line Away Inc | $33,900 | Stewart Title Guaranty Co | |
| The Tree Network Co Llc | $23,900 | Title First | |
| Federal National Mortgage Association | $40,000 | Ohio Title | |
| Anderson Myra M | -- | Fidelity Land Title Agency I | |
| Carter Kristien N | $75,000 | -- | |
| Townsend Charles W | $29,500 | -- | |
| Kimmel Brook Properties Llc | $23,900 | Preferred Title | |
| Trf Properties Inc | $23,000 | Preferred Title Agency Inc | |
| Wright Investments | $21,500 | Preferred Title | |
| Beebles Investment Inc | $18,000 | -- | |
| Wheat Jerald E | $28,000 | -- |
Source: Public Records
Mortgage History
| Date | Status | Borrower | Loan Amount |
|---|---|---|---|
| Previous Owner | Anderson Myra M | $122,747 | |
| Previous Owner | Carter Kristien N | $71,250 |
Source: Public Records
Tax History
| Year | Tax Paid | Tax Assessment Tax Assessment Total Assessment is a certain percentage of the fair market value that is determined by local assessors to be the total taxable value of land and additions on the property. | Land | Improvement |
|---|---|---|---|---|
| 2025 | $244 | $5,320 | $5,320 | -- |
| 2024 | $244 | $5,320 | $5,320 | -- |
| 2023 | $0 | $5,320 | $5,320 | $0 |
| 2022 | $0 | $1,960 | $1,960 | $0 |
| 2021 | $0 | $1,960 | $1,960 | $0 |
| 2020 | $0 | $1,960 | $1,960 | $0 |
| 2019 | $0 | $1,680 | $1,680 | $0 |
| 2018 | $0 | $1,680 | $1,680 | $0 |
| 2017 | $0 | $5,710 | $1,680 | $4,030 |
| 2016 | $0 | $5,710 | $1,680 | $4,030 |
| 2015 | -- | $5,710 | $1,680 | $4,030 |
| 2014 | $597 | $5,710 | $1,680 | $4,030 |
| 2013 | $597 | $6,335 | $1,855 | $4,480 |
Source: Public Records
Map
Nearby Homes
- 1554 E Maynard Ave
- 1564-1566 E Blake Ave
- 2126 Cleveland Ave
- 2163 Cleveland Ave Unit 2161
- 0 E Maynard Ave
- 1625 Kenmore Rd
- 1684 E Blake Ave
- 1608 Kenmore Rd
- 1457 Cordell Ave
- 1810 E 26th Ave
- 1481 Kohr Place
- 1430 Kenmore Rd
- 2195 Dresden St
- 1435 Kohr Place
- 1335 E 25th Ave Unit 337
- 2305 Cleveland Ave
- 1362 Clinton St
- 1301 E 26th Ave
- 1386 E 22nd Ave
- 1326 E 23rd Ave
- 1553 E Maynard Ave
- 1549 E Maynard Ave
- 1545 E Maynard Ave
- 1552 Duxberry Ave
- 1556 Duxberry Ave
- 1548 Duxberry Ave
- 1539 E Maynard Ave
- 1562 Duxberry Ave
- 1542 Duxberry Ave
- 1566 Duxberry Ave
- 1564 E Maynard Ave
- 1558 E Maynard Ave
- 1538 Duxberry Ave Unit 540
- 1538 Duxberry Ave Unit 40
- 1535 E Maynard Ave
- 1550 E Maynard Ave
- 1570 Duxberry Ave
- 1534 Duxberry Ave
- 1572 E Maynard Ave Unit 580
- 1546 E Maynard Ave
Your Personal Tour Guide
Ask me questions while you tour the home.