Estimated Value: $222,000 - $312,000
1
Bed
1
Bath
336
Sq Ft
$748/Sq Ft
Est. Value
About This Home
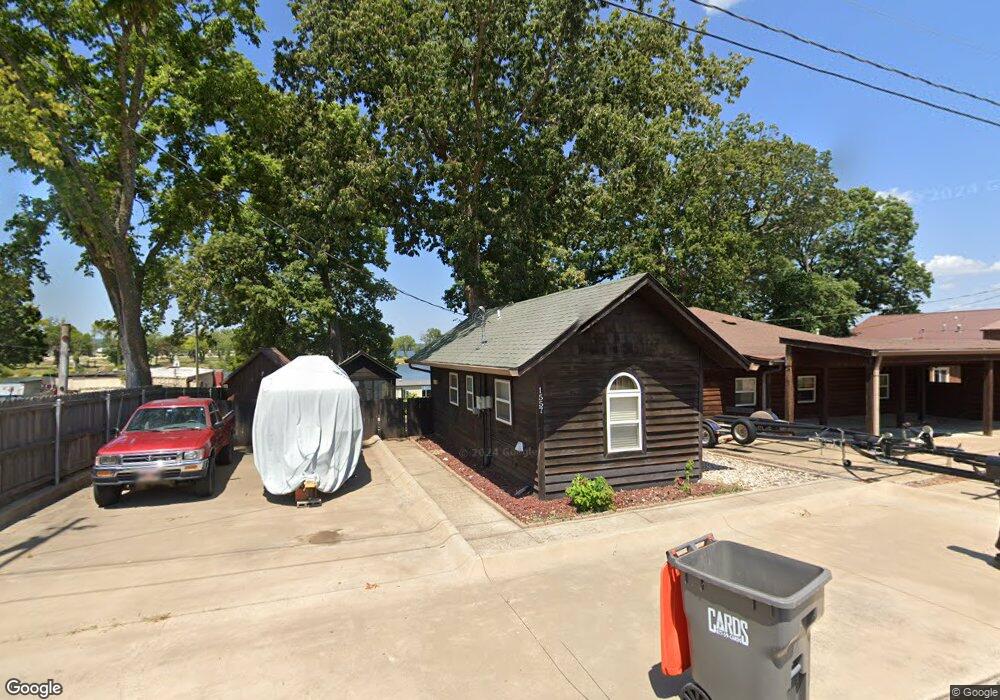
This home is located at 1557 N 110th St, Grove, OK 74344 and is currently estimated at $251,187, approximately $747 per square foot. 1557 N 110th St is a home located in Delaware County with nearby schools including Grove Lower Elementary School, Grove Upper Elementary School, and Grove Middle School.
Ownership History
Date
Name
Owned For
Owner Type
Purchase Details
Closed on
Jun 29, 2023
Sold by
Michaels Rental Center Llc
Bought by
Jgr Gateway Properties Llc
Current Estimated Value
Home Financials for this Owner
Home Financials are based on the most recent Mortgage that was taken out on this home.
Original Mortgage
$672,700
Outstanding Balance
$549,386
Interest Rate
6.09%
Mortgage Type
New Conventional
Estimated Equity
-$298,199
Purchase Details
Closed on
Dec 9, 2022
Sold by
Ambrus Frank Weldon
Bought by
Fine David Steven
Purchase Details
Closed on
Mar 1, 2017
Sold by
Reidy Joseph and Reidy Rhonda M
Bought by
Ambrus Frank Weldon and Ambrus Frances
Purchase Details
Closed on
Aug 15, 1991
Sold by
Sweney James C and Sweney Teresa K
Purchase Details
Closed on
Jul 31, 1989
Sold by
Bonham Byron W and Bonham Norma J
Purchase Details
Closed on
Mar 9, 1988
Sold by
Husong Robert
Create a Home Valuation Report for This Property
The Home Valuation Report is an in-depth analysis detailing your home's value as well as a comparison with similar homes in the area
Home Values in the Area
Average Home Value in this Area
Purchase History
| Date | Buyer | Sale Price | Title Company |
|---|---|---|---|
| Jgr Gateway Properties Llc | -- | None Listed On Document | |
| Fine David Steven | $227,000 | Apex Title & Closing Service | |
| Ambrus Frank Weldon | $99,000 | None Available | |
| -- | $27,000 | -- | |
| -- | -- | -- | |
| -- | $50,000 | -- |
Source: Public Records
Mortgage History
| Date | Status | Borrower | Loan Amount |
|---|---|---|---|
| Open | Jgr Gateway Properties Llc | $672,700 |
Source: Public Records
Tax History Compared to Growth
Tax History
| Year | Tax Paid | Tax Assessment Tax Assessment Total Assessment is a certain percentage of the fair market value that is determined by local assessors to be the total taxable value of land and additions on the property. | Land | Improvement |
|---|---|---|---|---|
| 2025 | $2,114 | $26,477 | $11,113 | $15,364 |
| 2024 | $2,114 | $26,105 | $11,113 | $14,992 |
| 2023 | $2,114 | $13,180 | $9,983 | $3,197 |
| 2022 | $1,048 | $12,829 | $9,975 | $2,854 |
| 2021 | $996 | $12,552 | $9,975 | $2,577 |
| 2020 | $965 | $11,385 | $9,975 | $1,410 |
| 2019 | $968 | $11,385 | $9,975 | $1,410 |
| 2018 | $966 | $11,385 | $9,975 | $1,410 |
| 2017 | $969 | $11,385 | $9,975 | $1,410 |
| 2016 | $1,080 | $12,696 | $4,600 | $8,096 |
| 2015 | $1,096 | $12,696 | $4,600 | $8,096 |
| 2014 | $1,101 | $12,696 | $4,600 | $8,096 |
Source: Public Records
Map
Nearby Homes
- 1530 Grand Regatta Dr
- 10401 Wolf Creek Dr
- 1530 Grand Regatta #27 Dr
- 10005 Wolf Creek Dr
- 0 Tbd Hwy 59 - 911 Address Tbd
- 000 Highway 59 911 Address Tbd
- 25990 S 585 Rd Unit 2
- 25421 Us-59 (Tbd)4
- 25421 Us-59 (Tbd)3
- 25421
- 25421 Us-59 (Tbd)1
- 827 Chatsworth Dr
- 827 Apple Dr
- 1426 Kings Place
- 822 Chatsworth Dr
- 25396 S 585 Loop
- 25680 S 608 Ln
- 816 Chatsworth Dr
- 25301 S 599 Rd
- 25123 S 613 Rd
- 1537 110th St NW
- 1535 110th St NW
- 1535 N 110th St
- 1533 110th St NW
- 1563 N 110th St
- 1557 110th St NW
- 1564 110th St NW
- 1531 110th St NW
- 10822 Wolf Creek Dr
- 1562 110th NW
- 1562 110th St NW
- 10819 Wolf Creek Dr
- 1564 N 110th St
- 1568 N 110th St
- 0 Groveport Dr
- 1565 N 110th St
- 1565 110th St NW
- 1565 110th St NW
- 1528 Lucky 7 Dr
- 10677 Wolf Creek Dr