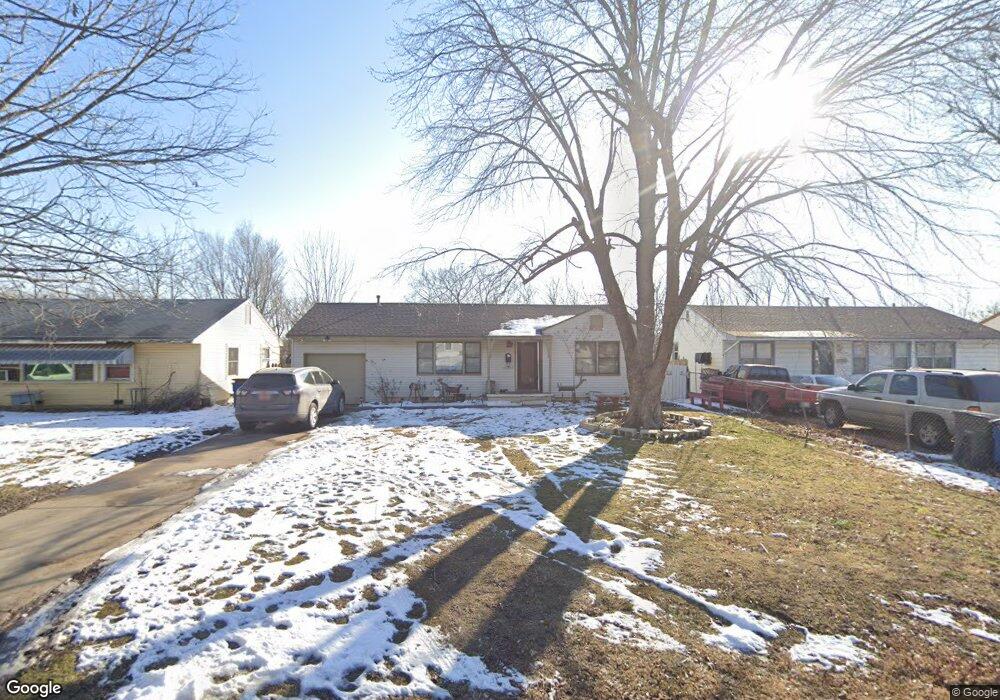
1557 N Oswego Ave Tulsa, OK 74115
Louisville Heights NeighborhoodEstimated Value: $102,906 - $138,000
2
Beds
1
Bath
842
Sq Ft
$141/Sq Ft
Est. Value
About This Home
This home is located at 1557 N Oswego Ave, Tulsa, OK 74115 and is currently estimated at $118,727, approximately $141 per square foot. 1557 N Oswego Ave is a home located in Tulsa County with nearby schools including Monroe Demonstration Academy, McLain High School of Science and Technology, and Sts. Peter & Paul Catholic School.
Ownership History
Date
Name
Owned For
Owner Type
Purchase Details
Closed on
May 18, 2007
Sold by
Oltman Homes Inc
Bought by
Smith Linda and Smith Larry
Current Estimated Value
Home Financials for this Owner
Home Financials are based on the most recent Mortgage that was taken out on this home.
Original Mortgage
$59,926
Outstanding Balance
$36,073
Interest Rate
6.16%
Mortgage Type
FHA
Estimated Equity
$82,654
Purchase Details
Closed on
Jan 17, 2007
Sold by
Clearwater Development Llc
Bought by
Oltman Homes Inc
Home Financials for this Owner
Home Financials are based on the most recent Mortgage that was taken out on this home.
Original Mortgage
$45,003
Interest Rate
6.09%
Mortgage Type
Construction
Purchase Details
Closed on
Jan 10, 2007
Sold by
Glass Jeremy J
Bought by
Clearwater Development Llc
Home Financials for this Owner
Home Financials are based on the most recent Mortgage that was taken out on this home.
Original Mortgage
$45,003
Interest Rate
6.09%
Mortgage Type
Construction
Create a Home Valuation Report for This Property
The Home Valuation Report is an in-depth analysis detailing your home's value as well as a comparison with similar homes in the area
Home Values in the Area
Average Home Value in this Area
Purchase History
| Date | Buyer | Sale Price | Title Company |
|---|---|---|---|
| Smith Linda | $60,500 | First American Title & Abstr | |
| Oltman Homes Inc | -- | Firstitle & Abstract Service | |
| Clearwater Development Llc | $33,900 | None Available |
Source: Public Records
Mortgage History
| Date | Status | Borrower | Loan Amount |
|---|---|---|---|
| Open | Smith Linda | $59,926 | |
| Previous Owner | Oltman Homes Inc | $45,003 |
Source: Public Records
Tax History Compared to Growth
Tax History
| Year | Tax Paid | Tax Assessment Tax Assessment Total Assessment is a certain percentage of the fair market value that is determined by local assessors to be the total taxable value of land and additions on the property. | Land | Improvement |
|---|---|---|---|---|
| 2025 | $1,032 | $7,704 | $800 | $6,904 |
| 2024 | $887 | $7,337 | $914 | $6,423 |
| 2023 | $887 | $6,988 | $1,001 | $5,987 |
| 2022 | $887 | $6,655 | $1,144 | $5,511 |
| 2021 | $879 | $6,655 | $1,144 | $5,511 |
| 2020 | $867 | $6,655 | $1,144 | $5,511 |
| 2019 | $912 | $6,655 | $1,144 | $5,511 |
| 2018 | $914 | $6,655 | $1,144 | $5,511 |
| 2017 | $912 | $6,655 | $1,144 | $5,511 |
| 2016 | $893 | $6,655 | $1,144 | $5,511 |
| 2015 | $761 | $6,655 | $1,144 | $5,511 |
| 2014 | $753 | $6,655 | $1,144 | $5,511 |
Source: Public Records
Map
Nearby Homes
- 1820 N Oswego Ave
- 1814 N Jamestown Ave
- 1339 N Richmond Ave
- 2138 N Oswego Ave
- 1823 N Harvard Ave
- 1217 N Oswego Ave
- 2239 N Marion Ave
- 3821 E Xyler St
- 1401 N Yale Ave
- 1327 N Winston Ave
- 1055 N New Haven Ave
- 3503 E Xyler St
- 1049 N Oswego Ave
- 3150 E Woodrow St
- 1525 N College Ave
- 1645 N College Ave
- 3139 E Woodrow St
- 4722 E Marshall St
- 1317 N Braden Ave
- 2918 E Woodrow St
- 1553 N Oswego Ave
- 1563 N Oswego Ave
- 1547 N Oswego Ave
- 1567 N Oswego Ave
- 1571 N Oswego Ave
- 1541 N Oswego Ave
- 1558 N Oswego Ave
- 1554 N Oswego Ave
- 1564 N Oswego Ave
- 1548 N Oswego Ave
- 1568 N Oswego Ave
- 1537 N Oswego Ave
- 4010 E Reading Place
- 4004 E Reading Place
- 1544 N Oswego Ave
- 4014 E Reading Place
- 1572 N Oswego Ave
- 4020 E Reading Place
- 1578 N Oswego Ave
- 1538 N Oswego Ave